
The US Bureau of the Census has just released detailed county to county and place (municipality) to place work trip flow tables. This new data is the most comprehensive since the 2000 census and covers 2006 to 2008.
The county to county data is particularly useful for analysis in the nation's largest metropolitan area (Note 1), New York. The New York metropolitan area has more than 19 million people and stretches across 6,700 square miles of land area, one half of it in the urban area, which is the urban footprint that includes all areas, including suburbs, in the continuous urbanization (3,350 square miles) and the other half rural (Note 2). This area is composed of 23 counties, which makes far finer grain analysis possible than in Los Angeles, with just two counties or San Diego, where its single county precludes any county based metropolitan area analysis.
The New York metropolitan area’s counties extend east to west from Suffolk on Long Island to Pike in Pennsylvania and north to south from Putnam in the Hudson Valley to Ocean on the New Jersey shore. Surprisingly, it does not include Fairfield and New Haven counties in Connecticut, which have strong economic ties to the urban area (and which are a part of the larger, Census designated "combined statistical area"). Indeed, major parts of these two counties can be considered part of the New York urban area (Note #3).
Median house age is a useful indicator of the urban form in segments of a metropolitan area. This examination breaks the New York metropolitan area into rings. The core is New York County (Manhattan, where the median construction date of owned dwellings is 1942). The first ring is the other four boroughs of New York City. The inner ring includes counties outside the city in which the median aged house was built in the 1950s, while the outer ring includes counties in which the median aged house was built in the 1960s or later. The one anomaly is Staten Island (Richmond County) which although politically part of the city of New York, demonstrates a mean housing age closer to that of the outer ring (median construction date 1971). Visually it resembles late suburban New Jersey much more than it does the rest of the city. However, Staten Island's strong ties to the city justify its classification with the other boroughs.
Comparatively Centralized: New York is one of the most centralized large urban areas in the high income world,with only Tokyo ranking higher among areas over 5 million population. The Manhattan business district, located to the south of 59th Street is the world’s second largest (following Tokyo's Yamanote Loop). But in terms of employment density Manhattan has more than double the employment density. What was, at least until recently, indisputably the world's most spectacular skyline leads many to conclude that nearly everyone works in Manhattan.
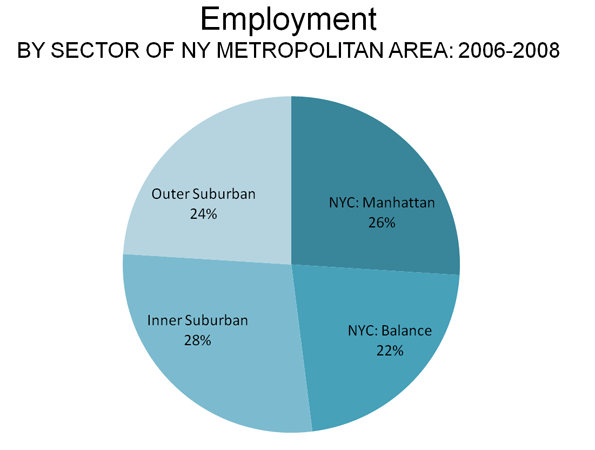
A Highly Decentralized Metropolitan Area: Yet in reality, New York is a highly decentralized metropolitan area. Approximately 74% of employment is outside Manhattan and the jobs are comparatively evenly dispersed among the sectors. There is more employment in the inner ring suburbs than in Manhattan (28%). Even the outer ring is competitive has nearly as many jobs, at 24%. Finally, the balance of the city, the four boroughs, has 22% of the employment (Figure 1).
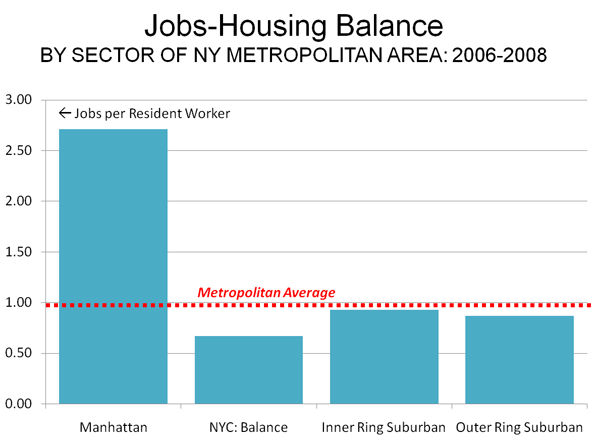
Wide Variations in the Jobs-Housing Balance: It is hard to understate the intensity of Manhattan’s central business district employment. Manhattan has 2.71 jobs for every resident worker. An important tenet of modern urban planning theory is to achieve a balance of jobs and housing. Manhattan's jobs/housing imbalance is certainly the most acute of any county in the United States, yet it is to Manhattan that purveyors of smart growth densification policies are routinely drawn.
Manhattan's huge excess of jobs contrasts with employment the rest of the the city, where the jobs-housing balance at the county level is 0.67, the lowest in the metropolitan area. The inner ring suburbs have the highest jobs-housing balance at 0.93, while the outer suburbs have a jobs-housing balance of 0.87 (Figure 2), nearly one-third higher than the non-Manhattan boroughs (three of which are more dense than any major municipal jurisdiction in the nation). The city's strongest jobs-housing balance is in Brooklyn (Kings County), at 0.72, which is lower than all of the suburban counties except for the most remote (Pike, Putnam and Sussex).
Manhattan's Impact: Diminishing Rapidly with Distance: There is no doubt that Manhattan remains the core of the New York economy, but that is less true the further you go out. While nearly 70% of the core’s workers commute from outside Manhattan, the employment influence of Manhattan drops off like the temperature falls the further you get away from a fireplace.
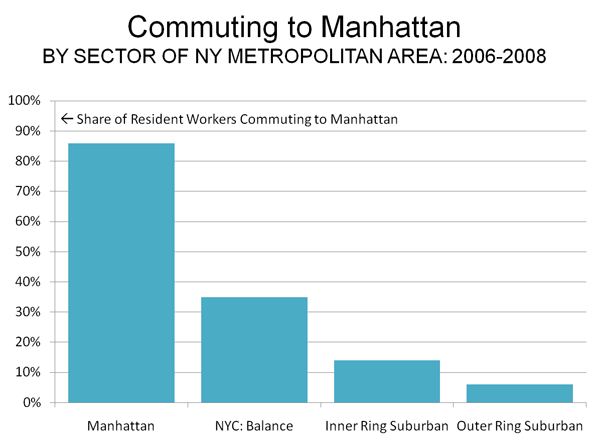
86% of Manhattan's resident workers have jobs in Manhattan, but only 35% of workers living in the city's other boroughs work in Manhattan. This falls off to 14% in the inner suburban counties and 6% in the outer suburban counties (Figure 3). In Sussex County and Ocean County, New Jersey, only 2% of resident workers commute to Manhattan.
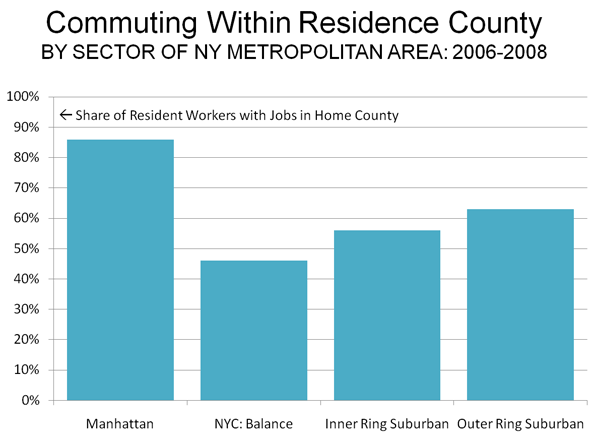
Working Close to Home: At the same time a larger number of resident workers outside Manhattan work in their home counties than work in Manhattan. In the balance of the city, 46% of workers have jobs in the same counties. The inner suburban counties employ 56% of their resident workers, while the outer suburban counties employ 63%. Overall, 58% of New Yorkers work in their county of residence, more than double the share that work in Manhattan (Figure 4). In Richmond County (Staten Island), Suffolk County and Rockland counties in New York and Pike County, Pennsylvania, more than 80% of jobs are filled by local residents.
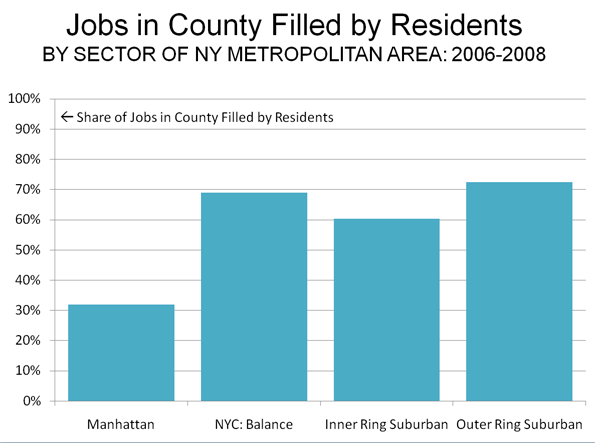
Local Workers Generally Come from the Same Counties: A review of the residential location of workers by job location reinforces the dominantly local nature of commuting in New York. Overall, 56% of jobs are filled by residents of the same county. The figure is the highest in the outer ring suburban counties, at 73%. The inner ring suburban areas draw 60% of their workers from the same county, while the balance of the city draws 69%. In Manhattan, with its seriously out of balance jobs and housing, just 32% of the jobs are filled by it residents (Figure 5).
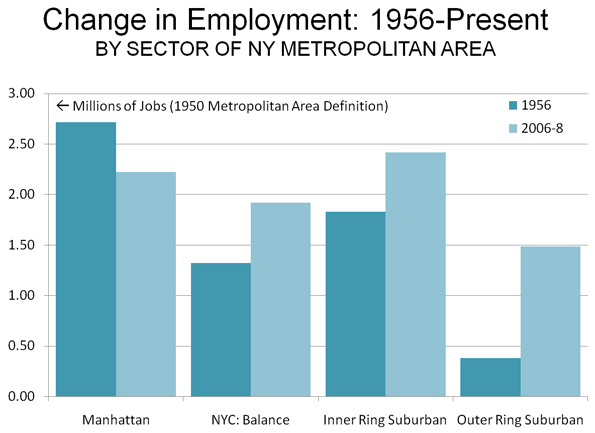
Dispersion: Past and Present. All of this is a huge change from a half-century ago. In 1956 (according to data in the classic Anatomy of A Metropolitan Area, by Edgar M. Hoover and Raymond Vernon), Manhattan accounted for 43% of the metropolitan area's employment (1950 metropolitan definition). Since that time, employment has fallen substantially in Manhattan and risen elsewhere. There have been gains in the outer boroughs, related principally to the strong population growth Queens and Staten Island. There were also gains in the inner suburban counties. The strongest gains were in the outer suburban counties (Figure 6).
The dispersion is continuing. As Ed McMahon and I showed in Empire State Exodus, there is considerable migration from New York to Pennsylvania, as people are moving to metropolitan areas such as Allentown and Wilkes-Barre. Obviously, as the modest level of commuting from the outer counties of metropolitan New York indicates, relatively few of these people are commuting to Manhattan. This impression may be more a product of the fact the Manhattan-based media only recognizes workers when they actually make it into town; those who stay in the periphery, it seems, might as well live on another planet.
New York, with as by far the strongest central business district in the nation, still has moved from virtual monocentrism, to the Edge Cities polycentrism of Joel Garreau and increasingly even to the amorphous Edgeless Cities
employment dispersion of Robert Lang. The strong core continues to regenerate, but no longer exerts anything like its former dominant influence.
-------
Note 1: For complete data.
Note 2: For a description of urban terms (metropolitan area, urban area, etc).
Note 3: Demographia World Urban Areas includes the continuous urbanization of southwestern Connecticut as a part of the New York urban area.
-------
| Table 1 | ||||||||
| COMMUTING IN THE NEW YORK METROPOLITAN AREA (2006-2008): SUMMARY BY GEOGRAPHIC RING | ||||||||
| RINGS | Ring | Jobs/Housing Balance (Jobs per Resident Worker) | Workers Employed in Residence County | Share of Jobs Filled by County Residents | Workers Employed in New York County (Manhattan) | Average One-Way Work Trip Time (Minutes): Residence | Average One-Way Work Trip Time (Minutes): Workplace | Median Year Owned Housing Built |
| NYC: Manhattan | 1 | 2.719 | 86.3% | 31.7% | 86.3% | 30.3 | 49.1 | 1942 |
| NYC: Balance | 2 | 0.674 | 46.4% | 68.8% | 35.6% | 42.0 | 37.3 | 1939-1971 |
| Inner Ring | 3 | 0.927 | 56.0% | 60.4% | 14.4% | 30.5 | 29.1 | 1950-1956 |
| Outer Ring | 4 | 0.870 | 63.1% | 72.5% | 6.2% | 31.3 | 26.0 | 1967-1983 |
| New York MSA | 1.000 | 57.6% | 57.6% | 26.1% | 34.5 | 35.5 | 1955 | |
| Derived from American Community Survey data (2006-2008) | ||||||||
| Note: MSA work trip times (residence and work location) differ because commuters from outside the MSA are included | ||||||||
| Table 2 | ||||||||
| COMMUTING IN THE NEW YORK METROPOLITAN AREA (2006-2008): SUMMARY BY COUNTY | ||||||||
| COUNTIES | Ring | Jobs/Housing Balance (Jobs per Resident Worker) | Workers Employed in Residence County | Share of Jobs Filled by County Residents | Workers Employed in New York County (Manhattan) | Average One-Way Work Trip Time (Minutes): Residence | Average One-Way Work Trip Time (Minutes): Workplace | Median Year Owned Housing Built |
| New York Co., NY | 1 | 2.719 | 86.3% | 31.7% | 86.3% | 30.3 | 49.1 | 1942 |
| Bronx Co., NY | 2 | 0.676 | 44.3% | 65.6% | 36.8% | 41.1 | 35.7 | 1950 |
| Kings Co., NY | 2 | 0.721 | 51.2% | 71.0% | 36.7% | 42.3 | 39.0 | 1939 |
| Queens Co., NY | 2 | 0.645 | 42.4% | 65.7% | 36.0% | 42.0 | 37.5 | 1949 |
| Richmond Co., NY | 2 | 0.585 | 47.3% | 80.8% | 26.3% | 42.7 | 29.8 | 1971 |
| Bergen Co., NJ | 3 | 0.960 | 56.7% | 59.1% | 15.0% | 29.3 | 27.2 | 1956 |
| Essex Co., NJ | 3 | 1.052 | 53.6% | 50.9% | 9.7% | 30.8 | 31.8 | 1953 |
| Hudson Co., NJ | 3 | 0.892 | 47.1% | 52.8% | 23.6% | 32.4 | 35.1 | 1950 |
| Passaic Co., NJ | 3 | 0.797 | 45.3% | 56.8% | 4.3% | 27.0 | 28.0 | 1954 |
| Union Co., NJ | 3 | 0.969 | 50.7% | 52.3% | 7.1% | 33.0 | 27.6 | 1954 |
| Nassau Co., NY | 3 | 0.884 | 59.1% | 66.8% | 14.8% | 31.6 | 30.0 | 1954 |
| Westchester Co., NY | 3 | 0.928 | 67.3% | 72.6% | 19.9% | 33.6 | 27.7 | 1955 |
| Hunterdon Co., NJ | 4 | 0.736 | 49.5% | 67.2% | 3.7% | 31.4 | 28.2 | 1978 |
| Middlesex Co., NJ | 4 | 0.943 | 58.5% | 62.0% | 7.7% | 26.9 | 25.8 | 1968 |
| Monmouth Co., NJ | 4 | 0.880 | 63.4% | 72.0% | 8.2% | 33.2 | 23.8 | 1970 |
| Morris Co., NJ | 4 | 1.097 | 58.7% | 53.5% | 5.4% | 29.4 | 31.2 | 1967 |
| Ocean Co., NJ | 4 | 0.723 | 63.4% | 87.7% | 2.0% | 31.1 | 21.3 | 1977 |
| Somerset Co., NJ | 4 | 0.988 | 46.7% | 47.3% | 5.6% | 31.0 | 31.1 | 1978 |
| Sussex Co., NJ | 4 | 0.565 | 44.5% | 78.8% | 2.3% | 38.2 | 23.7 | 1972 |
| Putnam Co., NY | 4 | 0.441 | 30.9% | 70.1% | 8.0% | 37.0 | 24.4 | 1967 |
| Rockland Co., NY | 4 | 0.763 | 61.2% | 80.1% | 12.0% | 29.8 | 25.1 | 1969 |
| Suffolk Co., NY | 4 | 0.872 | 76.2% | 87.4% | 5.7% | 29.8 | 23.5 | 1967 |
| Pike Co., PA | 4 | 0.574 | 45.9% | 80.0% | 4.6% | 44.1 | 25.2 | 1983 |
| New York MSA | 1.000 | 57.6% | 57.6% | 26.1% | 34.5 | 35.5 | 1955 | |
-------
Wendell Cox is a Visiting Professor, Conservatoire National des Arts et Metiers, Paris and the author of “War on the Dream: How Anti-Sprawl Policy Threatens the Quality of Life”
Photo: Levittown (Nassau County): Inner Suburban (photo by author)


