
The salary gap – where top-end incomes are rising faster than middle- and lower-end salaries – plays a large role in the affordability of middle-class housing along with interest rates and prices. Which factor has more influence depends on where you live and how you make your living.
Using some simplifying assumptions (20 percent down payment and a 30-year fixed-rate mortgage), today’s middle-class household increasingly cannot afford a middle-class home. Two things hurt this market: poor job outlook (impacts income) and interest rates (impacts affordability).
|
Cities |
Salary Needed |
Mortgage Rate |
Salary Gap |
Jobs/People Ratio |
Unemployment Rate |
|
Cleveland |
$33,714.17 |
3.96 |
10% |
.59 |
5.3 |
|
Pittsburgh |
$33,838.57 |
3.87 |
7% |
.61 |
5.1 |
|
Detroit |
$37,544.40 |
4.05 |
2% |
.54 |
5.6 |
|
Cincinnati |
$36,357.35 |
3.98 |
1% |
.60 |
4.0 |
|
St Louis |
$36,784.94 |
3.94 |
0% |
.62 |
5.0 |
|
Atlanta |
$39,356.45 |
3.97 |
-7% |
.61 |
5.5 |
|
Phoenix |
$43,170.07 |
3.97 |
-19% |
.59 |
5.3 |
|
Tampa |
$41,488.22 |
4.04 |
-23% |
.56 |
5.0 |
|
Minneapolis |
$50,969.96 |
3.96 |
-20% |
.69 |
3.5 |
|
Philadelphia |
$54,385.77 |
3.96 |
-34% |
.59 |
5.5 |
|
Baltimore |
$55,842.76 |
3.89 |
-34% |
.62 |
5.3 |
|
Houston |
$53,684.45 |
3.94 |
-41% |
.64 |
4.3 |
|
Orlando |
$46,300.92 |
3.99 |
-52% |
.61 |
4.8 |
|
San Antonio |
$48,092.30 |
3.99 |
-50% |
.60 |
3.4 |
|
Dallas |
$52,947.58 |
3.97 |
-44% |
.65 |
3.7 |
|
Sacramento |
$61,517.63 |
4.03 |
-47% |
.55 |
5.6 |
|
Chicago |
$61,068.50 |
3.97 |
-58% |
.60 |
5.5 |
|
Portland |
$65,009.41 |
4.01 |
-61% |
.61 |
5.5 |
|
Denver |
$69,912.24 |
4.04 |
-68% |
.67 |
3.7 |
|
Miami |
$63,289.86 |
4.00 |
-93% |
.59 |
5.2 |
|
Washington |
$83,027.24 |
3.90 |
-61% |
.67 |
4.3 |
|
Seattle |
$78,118.97 |
4.05 |
-69% |
.66 |
4.2 |
|
Boston |
$86,164.15 |
3.91 |
-78% |
.63 |
4.1 |
|
New York City |
$90,750.14 |
3.97 |
-102% |
.58 |
5.1 |
|
Los Angeles |
$88,315.32 |
3.94 |
-124% |
.59 |
6.0 |
|
San Diego |
$104,839.73 |
4.04 |
-161% |
.56 |
4.8 |
|
San Francisco |
$157,912.06 |
3.95 |
-211% |
.63 |
4.0 |
Salary Gap expressed as percent of Median Salary (that is, Salary Gap = (Median Salary minus Salary Needed) divided by Median Salary); negative numbers mean the salary needed to buy the median-priced home is greater than the median salary in that city. Data on salary needed and mortgage rates from http://www.hsh.com/finance/mortgage/salary-home-buying-25-cities.html; data on median salary from http://www.bls.gov/oes/current/oessrcma.htm. Unemployment rate for August 2015 and Participation rate is 2014 annual average from www.bls.gov.
In some ways, Minneapolis is not unlike San Francisco: both enjoy relatively low levels of unemployment and low mortgage costs. Nationally, the average 30-year mortgage rate is 4.09% (for July 17, 2015). Minneapolis and San Francisco are at 3.96% and 3.95%, respectively. Compared to the national unemployment rate of 5.3%, Minneapolis is at 3.5% and San Francisco is at 4.0%. So how do we explain the difference in affordability, aside from the realtor’s rant of “location, location, location”? San Francisco has a higher jobs/population ratio than Minneapolis, but that is only part of the story. As someone once told me when I was trying to understand why the jobs/housing relationship in Orange County didn’t fit the model: “What makes you think those people have jobs?”
In other words, where a population is less dependent on the traditional economy, higher home prices may be sustainable. This occurs in areas with a concentration of rich (“high-net-worth”) individuals. Some cities, like San Francisco and New York, are also attractive to rich homebuyers from outside the US. About 5% of existing home sales in California were to buyers from China (mainland, Hong Kong and Taiwan), who spent about $12 billion on homes primarily in San Francisco, Los Angeles and San Diego. The Chinese buyers paid an average of $831,000 per home – 69% paid with all-cash. In that sense, San Francisco is more like New York. The New York metro has an unemployment rate slightly below the national average, but only 57.8% as many jobs as there are people, compared to the national average of 59.2%. Foreign buyers from Canada and Mexico – who, along with China, make up about half of all foreign home buyers in the US – tend to buy in lower-priced housing markets in Florida, Arizona and Texas. Although more units are sold to international buyers in Florida (about 21% in 2015), the higher dollar volume is in California and New York. Homebuyers from Canada spent $6.4 billion in Florida and Arizona last year while buyers from China spent a total of $12 billion in California and New York. These statistics hint at a population that is less job-dependent, less “middle-class” than the national average.
The behavior of middle-class households in the decade before the 2008 collapse confirmed what I called a “distinct shift in the paradigm governing the housing market.” In November 2004, the stock market was climbing and the Fed was raising interest rates. The combination brought out talk of a real estate bubble. If investors started moving money away from housing they would be selling houses at a time when higher mortgage interest rates would make it more difficult to find buyers. That was 2004, mind you, not 2008; there were four years of housing prosperity ahead.
Under the new paradigm, rising stock market prices are neither cause nor effect for changes in residential real estate prices. (One exception is the New York metropolitan area, where Wall Street drives home prices by virtue of its impact on employment and income.) The break in the statistical relationship between Wall Street and Main Street started around 1980. In 1979, the Federal Reserve changed their policy away from interest rate targeting. As they attempted to control the supply of money, interest rates began to swing wildly. Households put more money in real estate when they saw more uncertainty in the economy. At the time I dubbed housing “A New Kind of Gold.” It wasn’t that the prices of houses behaved the same way as gold prices but because of the shared attitude from buyers. Gold is a traditional hedge against economic uncertainty. In the 1990s, people started buying homes when other investments seemed uncertain.
Prior to 1995, the Federal Reserve kept secret their monetary policy objectives. Twenty years later, we know that they are using the federal funds rate to reach targets for the money supply. Technically, the federal funds rate is the rate at which the Federal Reserve would like banks to lend to each other (although the banks are free to charge each other whatever they want). Banks also use the federal funds rate as the basis for setting consumer interest rates, like mortgage rates. Real estate investments are sensitive to interest rate changes in very specific ways. The total impact of current events on home prices will come from the Federal Reserve, regardless of what happens in the stock market. When interest rates rise it makes expansion more expensive for businesses by raising their borrowing costs. When businesses don’t expand, neither does employment. In addition to the fact that homes with mortgages become affordable to a smaller portion of the population, the impact on jobs is another reason why rising interest rates would reduce the demand for homes.
The gap between the mean- and median-priced homes was increasing across the country before the 2008 crisis, indicating that prices at the top of the scale were rising faster than the prices of more modest homes. The return of the home price gap to pre-1995 levels could have equalized affordability for middle-class Americans if income had followed suit. In addition to the poor employment outlook, fewer and fewer people will be able to afford the higher priced homes because the gap between mean- and median-income is rising faster than the home price gap is falling.
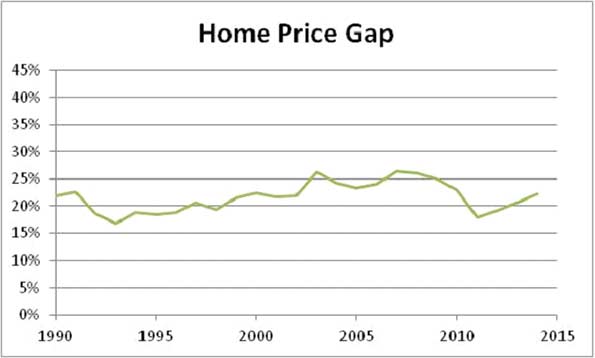
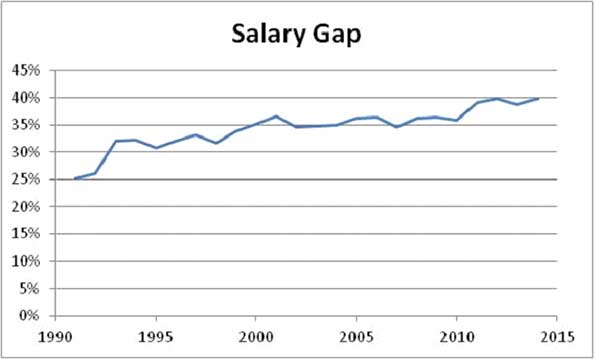
Median and mean (average) home sales prices are for new homes sold in the U.S. where the sales price includes land. Data from www.census.gov. Median and mean (average) salary from www.census.gov (Table H-13).
If the long-anticipated strengthening in the jobs market had appeared after the Great Recession, it could have made a real difference for middle-America. But so far, the employment recovery has not appeared. As weak job growth appeared in September, the previously encouraging July and August growth numbers were revised downward. The labor force participation rate declined, leaving only 59.2% of the population working. Population growth in the US is less than 1% per year but job growth is not keeping up with it.
|
Month 2015 |
Civilian Population Growth |
Employment Growth |
|
June |
199,362 |
-56,000 |
|
July |
205,661 |
101,000 |
|
August |
220,858 |
196,000 |
|
September |
233,715 |
-236,000 |
|
4-Month Total |
859,596 |
5,000 |
Civilian Population Growth based on population estimates from www.FactFinder.census.gov, Employment Growth based on number of persons employed from www.bls.gov.
As long as the monthly payments on median-priced homes are out of reach for median-income households, demand in the middle-class housing market cannot strengthen. This is one more reason the Federal Reserve cannot afford to raise interest rates this year. That doesn’t mean that they won’t do; just that they shouldn’t – that don’t always do that smart thing.
Housing photo courtesy of BigStockPhoto.com.
Susanne Trimbath, Ph.D. is CEO and Chief Economist of STP Advisory Services. Dr. Trimbath’s credits include appearances on national television and radio programs and the Emmy® Award nominated Bloomberg report Phantom Shares. She appears in four documentaries on the financial crisis, including Stock Shock: the Rise of Sirius XM and Collapse of Wall Street Ethicsand the newly released Wall Street Conspiracy. Dr. Trimbath was formerly Senior Research Economist at the Milken Institute. She served as Senior Advisor on United States Agency for International Development capital markets projects in Russia, Romania and Ukraine. Dr. Trimbath teaches graduate and undergraduate finance and economics.


