
Statistics Canada has just released the employment access data out of the 2016 Census, based on the main mode of commuting. Generally, there is little change between the modes, as Figure 1 indicates, compared to the 2011 Census results. (See: New Data on Commuting in Canada).
National Results
Automobiles continue to dominate work access (commuting, including travel and working at home, much of which is "telecommuting") in every census metropolitan area (CMA) of Canada (Table). Autos and other personal vehicles, including both those driven alone and those operating with passengers, accounted for 73.6 percent of work access, down from 74.2 percent in 2011.
Transit had the second largest share, at 11.5 percent, and improvement from 11.2 percent in 2011 and continues an increase from 10.2 percent in 2006. The combined walking and bicycle share increased slightly, to 6.5 percent, but remained below the 7.1 percent in 2006. Working at home increased to 7.4 percent, from 2011, with the largest increase of any commuting mode.
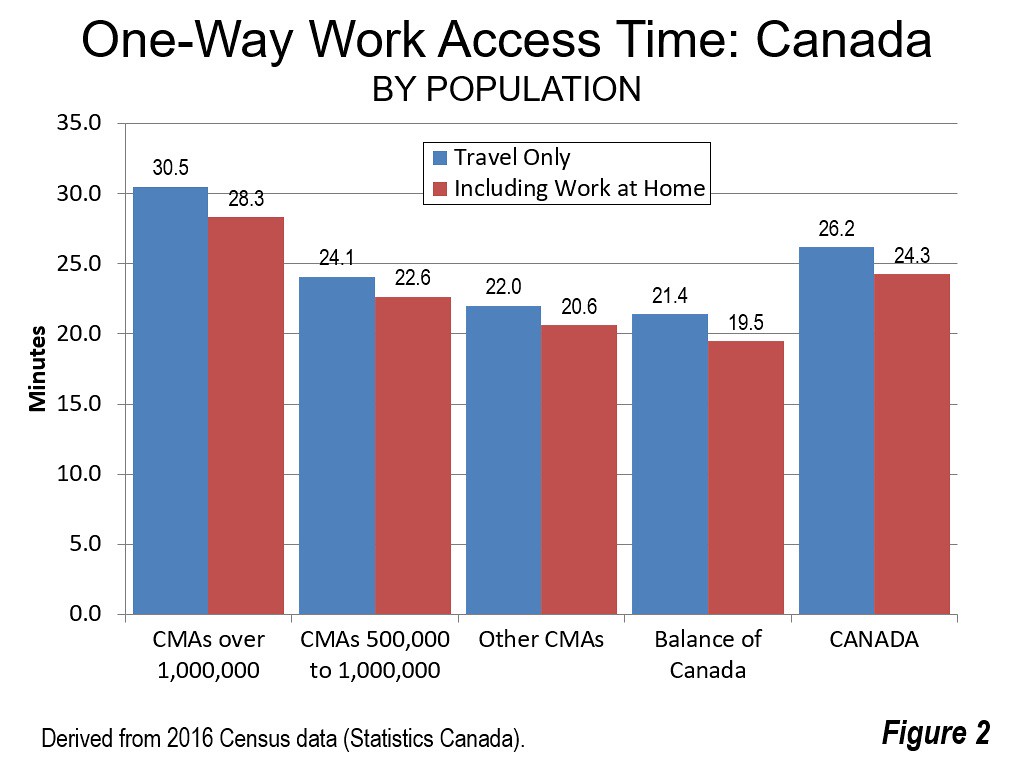
Overall, the national one-way work trip travel time was 26.2 minutes, which increased from 25.4 minutes in 2011. The average work access time, including those who work at home (whose travel time is zero minutes), was 24.3 minutes in 2016 (Figure 2).

Major Metropolitan Areas (1,000,000 and Over)
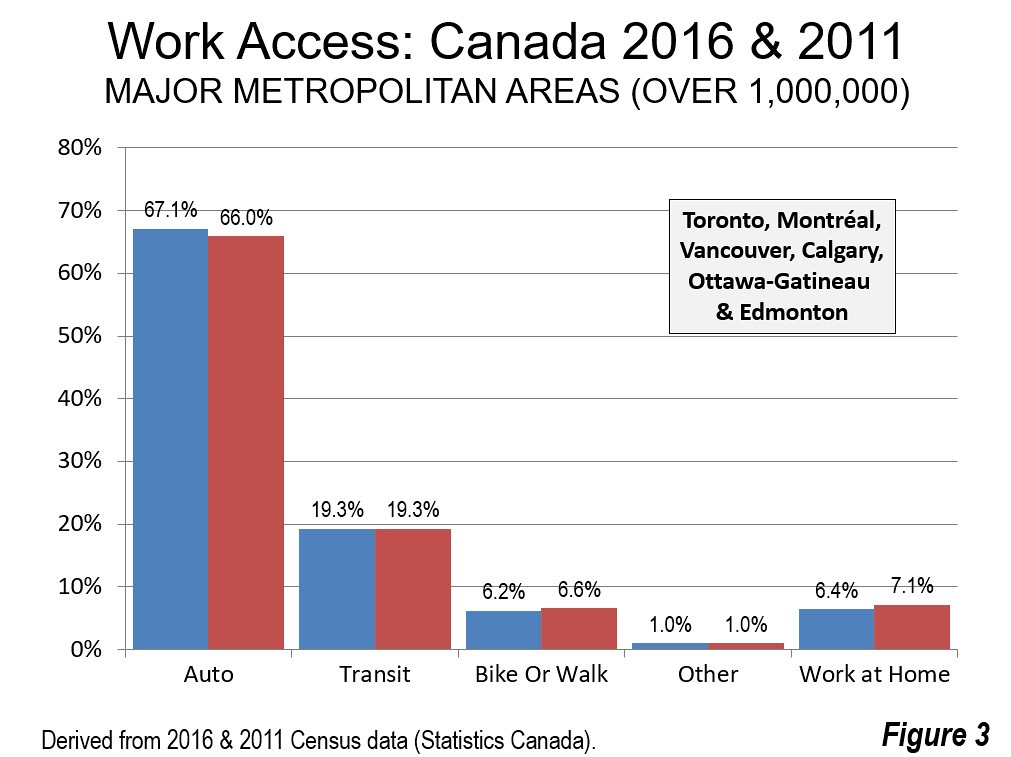
Among the metropolitan areas with more than 1,000,000 residents (Toronto, Montréal, Vancouver, Calgary, Ottawa-Gatineau and Edmonton), work access shares remained similar from the past. The number of people using cars for work access dropped slightly from 67.1 percent in 2011 to 66.1 percent in 2016. Transit's market share remained the same, at 19.3 percent. The share of commuters walking or cycling increased from 6.2 percent to 6.6 percent (Figure 3). Working at home increased to 7.0 percent from 6.4 percent, an increase greater than that of any other mode of commuting.
The average one-way work trip travel time in the major metropolitan areas was 30.5 minutes. The average work access time for all commuters, including those working at home, was 28.3 minutes, 17 percent longer than the national average.
Other Metropolitan Areas over 500,000 Population
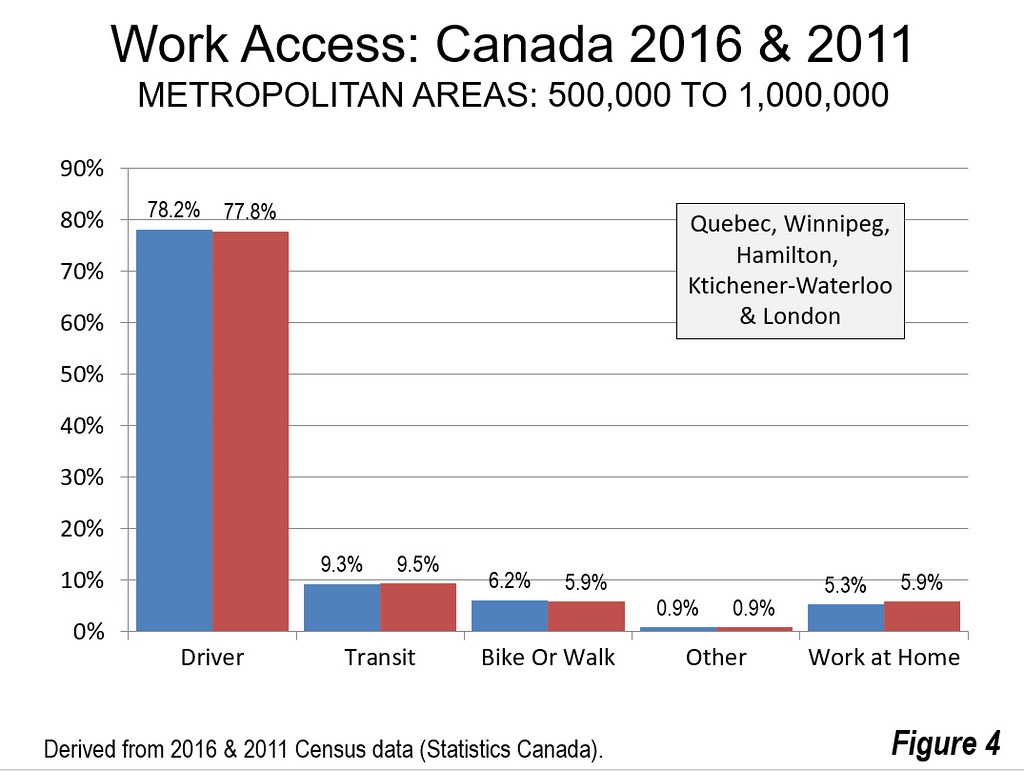
The next five largest metropolitan areas all have over 500,000 residents, according to the latest Statistics Canada estimates and include Québec (with its core municipality, the ville de Québec), Winnipeg, Hamilton, Kitchener-Waterloo and London. Auto use decreased from 78.2 percent in 2011 to 77.8 percent in 2016. Transit commuting rose from 8.5 percent in 2011 to 9.5 percent in 2016. The share for walking and cycling dropped slightly, while there was a healthy increase in working at home, from 5.3 percent in 2011 to 5.9 percent in 2016. Again, the largest gain was in working at home (Figure 4).
The average work trip travel time was 24.1 minutes. If those working at home are included, the average work access time was 22.6 minutes. This is seven percent shorter than the national average.
Metropolitan Areas with 100,000 to 500,000 Population
There are 24 metropolitan areas with between 100,000 and 500,000 population. The auto captures 81.3 percent of work access in these areas. Transit accounts for 5.1 percent of work access and 6.2 percent work at home. The average one-way work trip travel time is 22.0 minutes, or 20.6 minutes when those working at home are included. This is 15 percent less than the national average.
Outside Metropolitan Areas
Outside the metropolitan areas, 81.5 percent of commuters use cars, while 1.6 percent use transit. Walking and cycling account for 5.7 percent of commuting in these areas, a larger share than in the three metropolitan area categories described above. The non-metropolitan areas are also dominant in working at home, with a 9.1 percent share (this includes residents who live on their own farms). The average work trip travel time is 21.5 minutes. With those working at home, the work access time is 19.5 minutes, 20 percent below the national average.
Individual Metropolitan Area Highlights
The results among the largest metropolitan areas varied somewhat. In Toronto and Vancouver, transit's market share was up 3.5 percent (not percentage points) and 2.4 percent respectively, while car use was down 3.5 percent and 2.9 percent. Walking and cycling and working at home generally gained at least as many new commuters as transit. The work trip travel time in Toronto was 34.0 minutes, deteriorating from 32.8 minutes in 2011. Inclusion of those working at home reduces the travel time to 31.5 minutes. In Vancouver, the work trip travel time was 29.7 minutes, worsening from the 28.4 minutes in 2011. Working at home reduces the 2016 figure to 27.2 minutes.
In Montréal, car use was also down (0.7 percent) and transit use was down 0.1 percent. Walking and cycling and working at home were up. The work trip travel time was 30.0 minutes, a small increase from the 29.7 minutes of 2011. Including those working at home, the 2016 average travel time for commuters was 28.0 minutes.
The story was different in three metropolitan areas with between 1.0 and 2.5 million residents. In each, car use increased, though only marginally and transit use dropped. Transit use dropped significantly in Calgary (10.8 percent) and Ottawa-Gatineau (9.7 percent), while falling a smaller 0.7 percent in Edmonton. Working at home was up in all three. Travel times averaged 27.3 minutes in Ottawa-Gatineau, 26.5 minutes in Calgary and 25.9 minutes in Edmonton. With those working at home, the average travel times were 25.4 minutes, 24.6 minutes and 24.5 minutes, respectively.
Trends in a Stable Labor Market
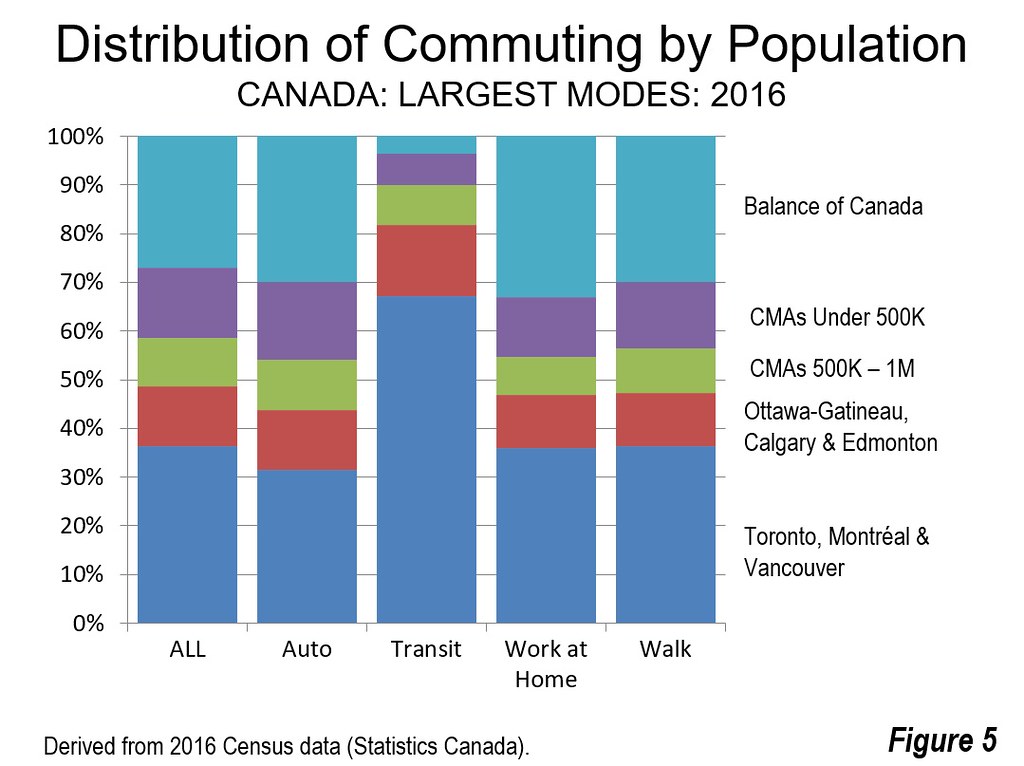
It might seem surprising that Canada's transit commuting share is not increasing significantly in light of the increasing public spending intended to attract people out of their cars. Even in a country with comparatively strong transit market shares, there are challenges. Part of the problem is transit projects that do not live up to their patronage projections, such as Toronto's Pearson Airport train (the "UP Express"). Transit use is highly concentrated in the three largest metropolitan areas, Toronto, Montréal and Vancouver (Figure 5). These labor markets have 36 percent of the commuting in the nation. They account for similar percentages of auto commuting (32 percent), working at home (36 percent) and walking (36 percent). In contrast to their 36 percent overall work access share, their share of transit commuting approaches twice that number (67 percent). And, much of that is concentrated is travel to and from the downtown (central business districts), which represent a small minority of overall employment in each metropolitan area. (See Improving the Competitiveness of Metropolitan Areas).
Moreover, migration trends do not favor the largest metropolitan areas. From 2011 to 2016, more than 225,000 net domestic migrants moved to other parts of the nation, all of which rely to a substantially smaller extent on transit. At the same time, the most sustainable mode of commuting, working at home, continues, as in the United States, to be growing more than any other mode. Out of the 35 metropolitan areas, 24 have work at home shares higher than their transit shares. This includes only one of the 11 metropolitan areas over 500,000 (Kitchener-Waterloo) and 20 of the 24 metropolitan areas under 500,000 The work at home gains, of course, have been at virtually no cost to taxpayers, and given the relationship between shorter commuting times and greater productivity this trend could lead to improved economic growth.
| Work Access Data: Metropolitan Areas | |||||||||
| 2016 Census: Canada | |||||||||
| Metropolitan Area (CMA) | Drive Alone | Car Pool (Including Driver) | Transit | Walk | Bicycle | Other | Work at Home | One-Way Travel Time | Access Tme Including Work at Home |
| Abbotsford | 70.3% | 15.3% | 2.3% | 2.9% | 0.5% | 1.2% | 7.5% | 26.1 | 24.1 |
| Barrie | 71.1% | 13.5% | 4.0% | 3.4% | 0.4% | 0.9% | 6.6% | 30.7 | 28.7 |
| Belleville | 73.1% | 12.2% | 2.2% | 4.9% | 0.9% | 1.0% | 5.7% | 19.7 | 18.6 |
| Brantford | 73.2% | 12.6% | 2.9% | 3.6% | 0.8% | 0.8% | 6.1% | 24.1 | 22.6 |
| Calgary | 61.7% | 10.6% | 13.4% | 4.3% | 1.4% | 1.4% | 7.2% | 26.5 | 24.6 |
| Edmonton | 67.4% | 10.5% | 10.6% | 3.5% | 0.9% | 1.4% | 5.6% | 25.9 | 24.5 |
| Guelph | 67.5% | 12.1% | 5.9% | 5.0% | 1.4% | 0.8% | 7.2% | 23.9 | 22.2 |
| Halifax | 58.1% | 14.6% | 11.0% | 7.6% | 0.9% | 1.2% | 6.5% | 24.0 | 22.4 |
| Hamilton | 66.4% | 12.0% | 9.2% | 4.0% | 0.8% | 0.8% | 6.8% | 28.4 | 26.5 |
| Kelowna | 67.4% | 10.6% | 3.5% | 4.1% | 2.4% | 2.6% | 9.4% | 19.8 | 17.9 |
| Kingston | 64.1% | 13.1% | 6.4% | 7.1% | 1.8% | 1.0% | 6.5% | 20.1 | 18.8 |
| Kitchener - Waterloo | 70.2% | 11.8% | 5.6% | 4.1% | 1.0% | 0.7% | 6.4% | 22.8 | 21.3 |
| Lethbridge | 73.1% | 10.9% | 2.7% | 3.7% | 1.3% | 1.0% | 7.4% | 16.8 | 15.6 |
| London | 66.9% | 12.5% | 6.8% | 5.2% | 1.1% | 0.9% | 6.7% | 21.9 | 20.4 |
| Moncton | 68.2% | 15.8% | 3.2% | 5.1% | 0.5% | 1.2% | 6.0% | 17.0 | 16.0 |
| Montréal | 57.0% | 8.0% | 20.8% | 4.9% | 1.9% | 0.8% | 6.7% | 30.0 | 28.0 |
| Oshawa | 69.0% | 11.7% | 9.0% | 2.9% | 0.3% | 0.9% | 6.3% | 33.5 | 31.4 |
| Ottawa - Gatineau | 55.0% | 12.1% | 17.1% | 5.9% | 2.2% | 0.9% | 6.9% | 27.3 | 25.4 |
| Peterborough | 67.6% | 12.5% | 3.6% | 6.2% | 1.5% | 0.9% | 7.7% | 22.7 | 20.9 |
| Québec | 65.8% | 10.0% | 10.5% | 5.9% | 1.2% | 0.8% | 5.6% | 22.4 | 21.1 |
| Regina | 71.0% | 13.5% | 4.8% | 3.8% | 1.0% | 0.8% | 5.0% | 17.9 | 17.0 |
| Saguenay | 79.1% | 8.8% | 2.1% | 3.8% | 0.3% | 1.3% | 4.5% | 17.7 | 16.9 |
| Saint John | 68.0% | 17.0% | 3.9% | 4.9% | 0.2% | 1.1% | 4.9% | 20.1 | 19.1 |
| Saskatoon | 70.4% | 12.4% | 4.1% | 3.9% | 1.8% | 1.5% | 5.9% | 19.7 | 18.5 |
| Sherbrooke | 72.9% | 9.9% | 3.9% | 5.2% | 0.7% | 0.8% | 6.7% | 19.0 | 17.7 |
| St. Catharines - Niagara | 73.0% | 11.9% | 2.5% | 4.2% | 0.8% | 1.0% | 6.4% | 21.5 | 20.1 |
| St. John's | 68.9% | 16.9% | 3.0% | 4.4% | 0.2% | 2.0% | 4.5% | 19.3 | 18.4 |
| Sudbury | 72.6% | 12.6% | 4.7% | 4.3% | 0.4% | 1.3% | 4.2% | 20.8 | 19.9 |
| Thunder Bay | 74.8% | 11.1% | 3.7% | 4.1% | 1.1% | 1.3% | 3.9% | 17.5 | 16.8 |
| Toronto | 52.3% | 10.7% | 22.5% | 4.9% | 1.3% | 0.9% | 7.4% | 34.0 | 31.5 |
| Trois-Rivières | 78.2% | 8.3% | 2.1% | 4.2% | 0.8% | 0.8% | 5.5% | 18.8 | 17.8 |
| Vancouver | 53.4% | 10.2% | 18.7% | 6.2% | 2.2% | 1.1% | 8.3% | 29.7 | 27.2 |
| Victoria | 53.8% | 10.1% | 10.0% | 9.5% | 6.0% | 2.2% | 8.4% | 22.2 | 20.3 |
| Windsor | 77.3% | 10.3% | 3.2% | 3.1% | 1.0% | 0.8% | 4.3% | 18.9 | 18.1 |
| Winnipeg | 61.4% | 14.1% | 13.0% | 4.4% | 1.6% | 1.0% | 4.6% | 24.0 | 22.9 |
| SUMMARY | |||||||||
| Population Category | Drive Alone | Car Pool (Including Driver) | Transit | Walk | Bicycle | Other | Work at Home | One-Way Travel Time | Access Tme Including Work at Home |
| CMAs >2,5M | 54.0% | 9.7% | 21.2% | 5.1% | 1.7% | 0.9% | 7.3% | 31.8 | 29.5 |
| CMAs 1M-2.5M | 61.4% | 11.1% | 13.7% | 4.5% | 1.5% | 1.2% | 6.6% | 26.6 | 24.8 |
| CMAs 0.5M-1M | 65.8% | 12.1% | 9.5% | 4.7% | 1.2% | 0.9% | 5.9% | 24.1 | 22.6 |
| Other CMAs | 68.9% | 12.4% | 5.1% | 4.8% | 1.3% | 1.2% | 6.2% | 22.0 | 20.6 |
| Outside CMAs | 68.5% | 12.2% | 4.1% | 5.3% | 1.0% | 1.3% | 7.7% | 22.1 | 20.4 |
| Canada | 62.4% | 11.2% | 11.5% | 5.1% | 1.3% | 1.1% | 7.4% | 26.2 | 24.3 |
| Derived from Statistics Canada data | |||||||||
Wendell Cox is principal of Demographia, an international public policy and demographics firm. He is a Senior Fellow of the Center for Opportunity Urbanism (US), Senior Fellow for Housing Affordability and Municipal Policy for the Frontier Centre for Public Policy (Canada), and a member of the Board of Advisors of the Center for Demographics and Policy at Chapman University (California). He is co-author of the "Demographia International Housing Affordability Survey" and author of "Demographia World Urban Areas" and "War on the Dream: How Anti-Sprawl Policy Threatens the Quality of Life." He was appointed to three terms on the Los Angeles County Transportation Commission, where he served with the leading city and county leadership as the only non-elected member. He served as a visiting professor at the Conservatoire National des Arts et Metiers, a national university in Paris.
Photograph: Toronto (by author)


