
Toronto seems guaranteed to retain its position as the densest urban area in North America (Canada and the United States), based on 2021 Census data recently released by Statistics Canada. The Toronto population centre (urban area) has grown at a rate of 0.8% annually since the 2016 census, while increasing its urban density to 3,088 persons per square kilometer.
Urban Areas (Population Centres in Canada) and Metropolitan Areas
“Urban area” is the international term for continuously built-up urban development. Urban areas are called “population centres” in Canada, “built up urban areas” in the United Kingdom and have been called “urbanized areas” in the United States (though that term is proposed for discontinuation in the 2020 census, to be replaced by “urban areas.”).
Urban areas are to be contrasted with metropolitan areas (labor markets), which are called Census Metropolitan Areas (CMAs) in Canada and metropolitan statistical areas (MSAs) in the United States (MSAs). Within the media and even among academics, it is not unusual for metropolitan areas and urban areas to be confused. But they are quite different. Urban areas and metropolitan areas are contrasted in detail in the “Note on Urban Areas” below.
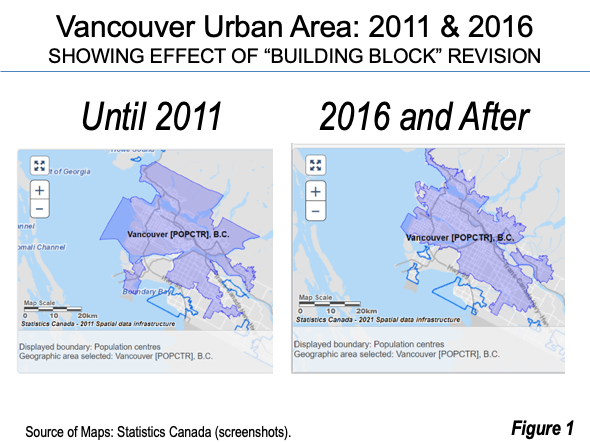
It only became possible to make more precise to make reliable urban density comparisons between Canadian and US urban areas five years ago. In 2000 and 2016, US and Canadian census authorities redefined the building blocks of urban areas to be small enumeration districts, which largely exclude rural land, instead of municipalities, which can include substantial rural land.
The difference is obvious in Statistics Canada maps of the Vancouver urban area in 2011 (before the building blocks were tightened) and 2016, when the revision took effect. In 2011, considerable rural territory was included in the mountains above North Vancouver, West Vancouver, Port Moody, and Coquitlam (Figure 1). Thus, the urban population density of Vancouver in 2011 was understated in 2011, as was the population density of the Los Angeles urban area before 2000, which stretched well to the near mile-high crest of the San Gabriel Mountains.
Number One Toronto and Number Two Los Angeles
The previous Toronto urban area density, from the 2016 census, was more than 10% above that of Los Angeles, which had 2,702 per square kilometer (comparable urban area data is not available for intercensal years).
The second ranked Los Angeles urban area seems sure to fall further behind Toronto, when the 2020 US census data is reported. The Los Angeles metropolitan area grew at a near zero rate of 0.2% annually from 2010 to 2020. Nearly all of the Los Angeles urban area is in the Los Angeles metropolitan area, and the peripheral portions to the outside (Lancaster, Palmdale, Santa Clarita, Orange County south of Irvine) grew faster than the metropolitan area). It would thus not be surprising if the Los Angeles urban area population declined from its 2010 level. The US Census Bureau has not announced a release date for the urban area data.
Comparing Toronto and Los Angeles to “Sprawling” New York
Analysts are often surprised to find out that New York is not the highest density urban area in the United States, much less North America. However, Toronto’s 2021 urban density is 50% greater than that of New York, and Los Angeles is 32% denser.
The high Los Angeles urban density has been problematic as both planners and media outlets have demonized it as the ultimate in urban expansion (pejoratively called urban sprawl). In fact, the ultimate is New York itself.
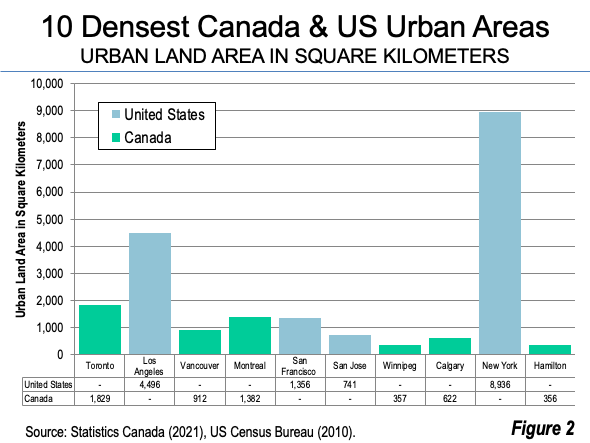
New York covers the most land area of any large urban area in the United States or Canada, and using slightly different criteria the most land area in the world (see: Demographia World Urban Areas). The US Census Bureau designated New York urban area covered 8,936 square kilometers in 2010, nearly double that of the Los Angeles urban area (4,496 square kilometers). The land areas of the 10 densest large urban areas in North America are illustrated in Figure 2. Indeed, the density of Los Angeles suburbs (in the urban area, but outside the city of Los Angeles) is 20% greater than that of the New York urban area, at 2,463, which also exceeds that of the San Jose urban area (below).
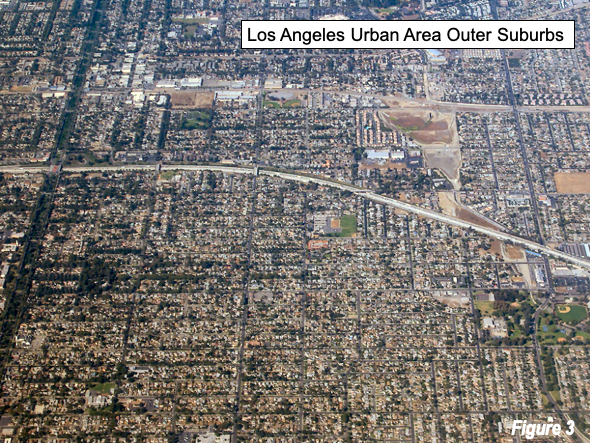
The key to Los Angeles urban area densities is its small lot sizes that extend well into the outer suburbs, which is indicated by an aerial photo of outer suburbs 55 kilometers from Los Angeles (Figure 3).
Winnipeg: Denser than New York, Along with 5 Others
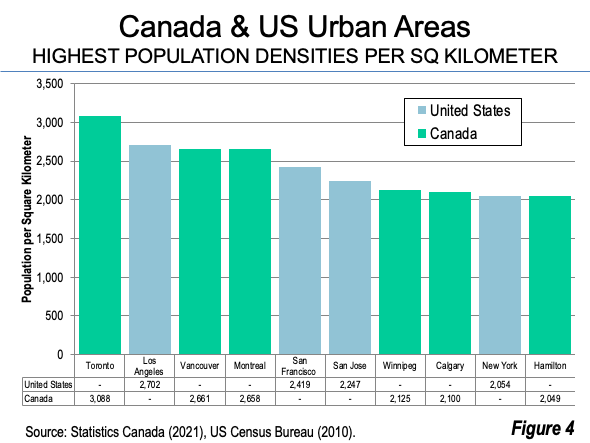
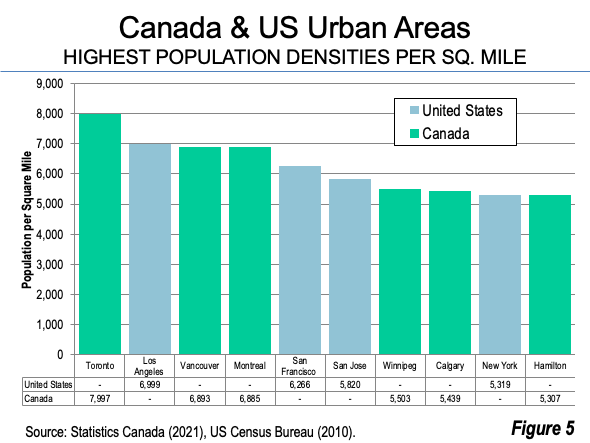
Figure 4 shows the 10 densest large urban areas in Canada and the United States, which indicates that six of the top 10 are in Canada. After Toronto and Los Angeles, the next six densest urban areas are Vancouver (2,661 per square kilometer), Montreal (2,658), San Francisco (2,419), San Jose (2,247), Winnipeg (2,125) and Calgary (2,100). That leaves New York (2,054) in 9th place, followed by Hamilton. Urban population per square mile is indicated in Figure 5.
Virtually All-Suburban San Jose is Denser than New York
Notably, one of these urban areas, San Jose, is composed virtually exclusively of post-World War II development, with 49% of its housing stock in detached single-family dwellings. According to the City Sector Model, metropolitan San Jose is more than 99% suburban or exurban. As a result, San Jose does not have a pre-war downtown, which typically had (and some still do) huge transit market shares. As a result, San Jose’s transit commuting share is below the national average (4.7% in 2019, compared to the US national average of 5.0%). Even so, largely suburban San Jose has an urban density nearly 10% higher than that of New York.
Agglomeration Diseconomies
Generally, as Shlomo Angel, formerly of the World Bank and now with the New York University Marron Institute and colleagues have shown, as cities (in the functional sense) grow larger, they tend to experience falling urban densities. In a few cases, this trend has been reversed, but has been accompanied by market distorting densification policies, such as urban containment. These policies raise the “floor level” of land prices (at the urban/rural boundary), which ripples through the urban area, leading to catastrophic losses in housing affordability (see Chapter 2: California’s Housing Crisis in Saving California). It is not unusual for house prices to double or triple relative to incomes. Toronto, San Francisco, and Vancouver may be the best examples of this in Canada and the US. The net effect is an agglomeration diseconomy that violates the very purpose of the city as suggested by Aristotle --- “living well,” something that is less achievable for most residents where the cost of living rises inexorably.
Note on Urban Areas (Population Centres) back to reference
Urban areas include only land that is classified by census authorities as urban and exclude the other category of land (rural land). Generically, urban areas are physical cities, and are independent of municipal, county, provincial and state boundaries. Generically, metropolitan areas are functional cities (also called economic cities), and include not only urban territory, but also the rural commuting shed of the largest urban area. In Canada, metropolitan areas are called “census metropolitan areas” (CMAs) and are analogous to “metropolitan statistical areas” in the United States.
As noted above, metropolitan areas are both rural and urban, yet their land areas are overwhelming rural. In 2021 the population centres (urban areas) within the metropolitan areas of Canada were composed of 89% rural and 11% urban land. The urban population density of the urban areas within these metropolitan areas was 1,997 per square kilometer. This is nine times the density of metropolitan areas at only 226, driven by the lack of urban density in the rural areas. By comparison, the latest data indicates the situation was similar in the United States (See: “The Rural Character of Metropolitan Areas”). As such, metropolitan are densities should not be used as an indicator of urban density in econometric (or other) analysis.
Wendell Cox is principal of Demographia, an international public policy firm located in the St. Louis metropolitan area. He is a founding senior fellow at the Urban Reform Institute, Houston, a Senior Fellow with the Frontier Centre for Public Policy in Winnipeg and a member of the Advisory Board of the Center for Demographics and Policy at Chapman University in Orange, California. He has served as a visiting professor at the Conservatoire National des Arts et Metiers in Paris. His principal interests are economics, poverty alleviation, demographics, urban policy and transport. He is co-author of the annual Demographia International Housing Affordability Survey and author of Demographia World Urban Areas.
Mayor Tom Bradley appointed him to three terms on the Los Angeles County Transportation Commission (1977-1985) and Speaker of the House Newt Gingrich appointed him to the Amtrak Reform Council, to complete the unexpired term of New Jersey Governor Christine Todd Whitman (1999-2002). He is author of War on the Dream: How Anti-Sprawl Policy Threatens the Quality of Life and Toward More Prosperous Cities: A Framing Essay on Urban Areas, Transport, Planning and the Dimensions of Sustainability.
Photo: by author, looking north on Bay Street toward Old City Hall, downtown Toronto.


