Nationwide transit ridership in December 2017 was nearly 5 percent less than December 2016. Ridership for the calendar year was 2.6 percent less than in 2016 and 6.7 percent less than 2014, transit’s recent peak. These numbers are based on the latest National Transit Database spreadsheet posted by the Federal Transit Administration.
As usual, I’ve supplemented the FTA file by summing the years (2002 through 2017 in columns GU through HJ), transit agencies (rows 2101 through 3098), and the 200 largest urban areas (rows 3101 through 3300). The resulting spreadsheet is about 8 megabytes. While these numbers may be preliminary, they provide a pretty good indication of the health — or lack of it — of the transit industry.
The results show that 2017 ridership was lower than in 2016 in all but two of the fifty largest urban areas: Phoenix and Seattle. As of the posting of November data, it appeared that Houston would be a member of this tiny club, but Houston’s December ridership fell by 1.1 percent from December 2016, leading 2017 as a whole to be 0.1 percent less than 2016. While some of that decline may have been due to Hurricane Harvey, the December drop off does not bode well for 2018.
Phoenix’s positive numbers may be deceptive as 2016 was a considerable drop from numbers posted in 2012 through 2014. As a result, while 2017 ridership was a 3.5 percent increase from 2016, it was still 4.7 percent less than 2013. Ridership will have to grow for a couple of more years before it reaches 2013 levels.
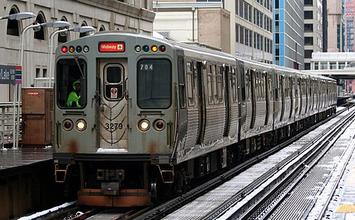
Despite the fact that the Washington Metro system completed its “safetrack” program and was no longer deliberately delaying trains, its ridership continued to fall, with December 2017 numbers being nearly 6 percent less than December 2016. WMATA often bragged that Metro rail was the second-most popular rail system in the country, but as the DC Policy Center noted yesterday, it has been overtaken by the Chicago Transit Authority. This isn’t because CTA numbers grew; just they they declined slower than DC Metro ridership. The tipping point came in July 2016; though Metrorail has sometimes beaten the CTA since then, since August 2017 CTA has remained firmly in the lead.
Of course, Washington and Chicago transit ridership combined are still only a small fraction — less than a quarter — of New York transit ridership. December ridership in the New York urban area, which includes New Jersey Transit, was 4.0 percent less than in 2016, and ridership for the year was 1.0 percent less.
Ridership is falling for all major kinds of transit. Comparing December 2017 with December 2016, commuter rail lost 3.5 percent of its riders; heavy rail 3.9 percent; light rail 4.7 percent; and buses — including rapid buses, commuter buses, and trolley buses — 6.0 percent. When compared with 2014, buses are down by nearly 11 percent.
All in all, 2017 was a disastrous year for the transit industry. Total ridership fell below 9.8 billion rides for the first time since 2006, and the 2.6 percent annual decline was the biggest drop since 1995. At the rate ridership is falling, it will be down to its 1995 low of 7.7 million rides in less than ten years. Transit agency leaders may fool themselves into thinking they can reverse this decline, but as the Antiplanner has explained elsewhere, it is unlikely.
This piece first appeared on The Antiplanner.
Randal O’Toole is a senior fellow with the Cato Institute specializing in land use and transportation policy. He has written several books demonstrating the futility of government planning. Prior to working for Cato, he taught environmental economics at Yale, UC Berkeley, and Utah State University.
Photo: Laurence's Pictures from USA [CC BY 2.0], via Wikimedia Commons


