
We are living amidst a sea change in demographic trends. According to the Census Bureau, the United States last year experienced its lowest population growth “since the founding of the nation” more than 230 years ago. This first full year of the pandemic estimates registered an annual growth rate to July 1, 2021 of 0.12%, a rate even lower than during the Spanish flu and World War I, from 1918 to 1919. Throughout the most recent decade, the nation’s annual growth rate had already been declining, as indicated in Figure 1 from the Census Bureau.
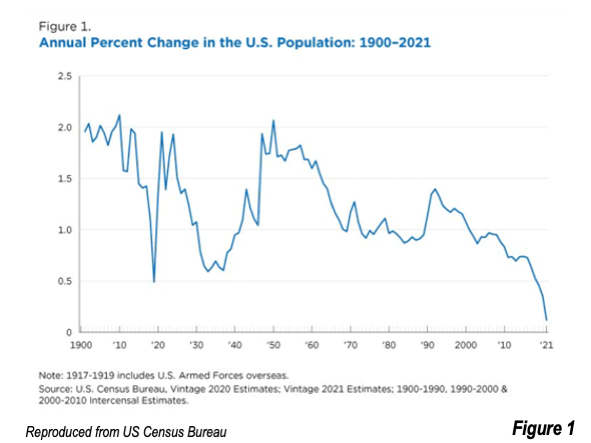
In the last non-pandemic year of 2019, national growth was nearly four times the 2021 rate, at 0.46%. In 2020, which was only partially influenced by the pandemic, growth was nearly three times as high, at 0.35%.
The 2021 Population Estimates
The latest Census Bureau release adds municipality (city) populations to the previously released national, state and county estimates for 2021. This article focuses on the core cities (historical urban municipalities) in the 56 major metropolitan areas (over 1,000,000 residents) as well as the suburbs (outside the core cities).
In this year of record low population growth, there were unprecedented major metropolitan area, core city and suburban losses. About half — 27 — of the major metropolitan areas lost population. A higher number of core cities — 39 — lost population (70%) of the core cities losing population. The suburbs lost population in 21 metropolitan areas (38%).
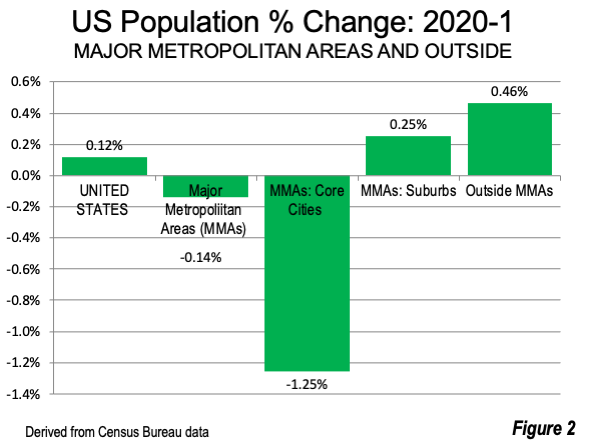
The population in the core cities declined by an aggregate 1.25%. The suburbs had a modest gain of 0.25%. But a larger gain occurred outside the major metropolitan areas, at 0.46% (Figure 2), indicating that the already evident dispersion was intensifying.
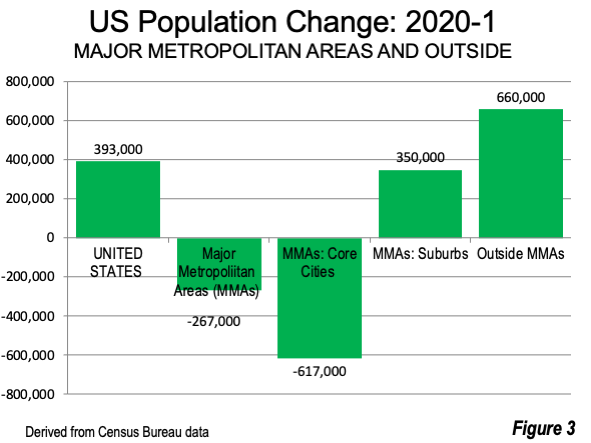
Overall, the major metropolitan areas lost 267,000 residents between 2020 and 2021, with the core cities losing a total of 617,000. The suburbs gained 350,000, nearly 1,000,000 more than the core cities. Outside the major metropolitan areas, there was a gain of 660,000 (Figure 3).
The table provides information on the 56 core cities.
Fastest Growth
Among each of the 10 fastest growing core cities, the suburbs grew more.
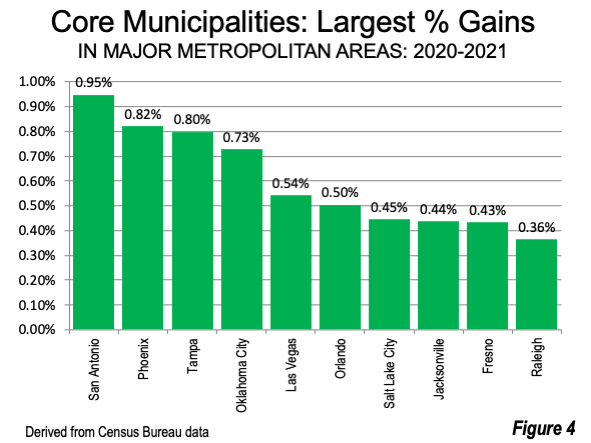
Six of the ten fastest growing core cities are located in South, widely spaced from San Antonio to Raleigh. The other four are in the West, with three in the Mountain West and one in California’s San Joaquin Valley (Fresno). All of these cities contain considerable post-War suburbanization within their municipal borders.
The strongest population growth was in highly suburbanized San Antonio, which added 13,600 residents (0.95%) to reach a population of 1,452,000. San Antonio is the seventh largest major metropolitan core city and comprises the largest share of the corresponding major metropolitan area population (55.8%). Yet, the suburbs gained more than twice as many residents (30,000).
Another largely low-density city, Phoenix, ranked fifth among the core cities, nearly equaled San Antonio’s increase, adding 13,200 new residents. This increased the city’s population to 1,625,000, or 0.82%. Suburban growth, however, was more than eight times as high, at 87,000.
Tampa had the third largest core city population increase, at 0.80%, adding 3,000 residents. The suburbs added 41,000 residents.
Oklahoma City gained 5,000 new residents for a fourth largest increase of 0.72%. The suburbs added 11,000.
The fifth largest percentage increase was in Las Vegas, at 0.54% (3,000). The suburban increase was 24,000.
Orlando, Salt Lake City, Jacksonville, Fresno and Raleigh rounded out the 10 fastest growing core cities. Suburban growth was greater in each of these metropolitan areas.
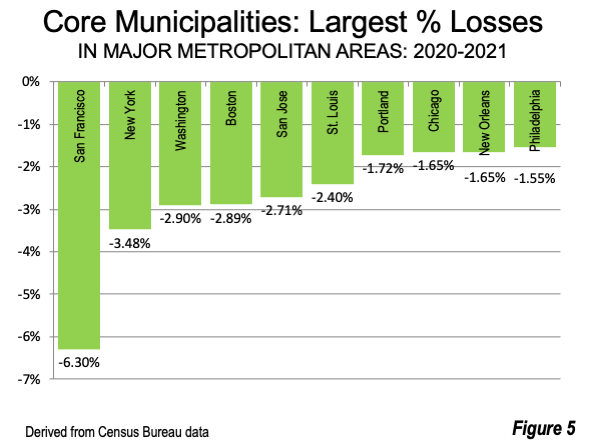
Largest Losses
The ten largest population losses included representatives from each of the nation’s four regions (Northeast, Midwest, South and West). Six of the ten were in core cities with the largest central business districts (downtowns), which were generally more disadvantaged by measures employed to control the pandemic.
San Francisco had by far the largest population loss, at 6.30%. of its 2020 population. The 55,000 loss took the city from its peak population of 870,000 in 2020 to 815,000 in 2021. This erased all of the city’s growth since 2011. The city’s population loss was 43% of the metro loss, more than twice its 18% share of the metropolitan population. (See the last column of the Table for the city percentages of metropolitan populations.
New York, the largest municipality in the nation fell from a population of 8,773,000 to 8,468,000, a loss of 3.48%. The resulting decline of 305,000 over the last year represented 82% of the metropolitan area population loss, nearly double the city’s 43% population share. This loss was more than 12 of the other core cities, such as Pittsburgh, St. Louis and Salt Lake City.
Since the April 1, 2020 census, New York lost 337,000 residents, equal to more than half of the surprising gain between the 2010 and 2020 censuses.
Washington lost 2.90% of its population (21,000). This was 70% of the metro loss, more tha six times the city’s share of the metropolitan area population.
Boston lost 2.48% of its population (21,000), or 47% of the total metropolitan area loss. This is well above the city’s 13% share of the population.
San Jose lost 2.73% of its population, falling 27,000 to 983,000.This continues a downward trend that began after San Jose reached its population peak of 1,034,000 in 2017. The suburban population loss was less, at 21,000. The city’s loss was 56% of the metropolitan loss, slightly above its 50% share of the population.
St. Louis fell 7,000 to 293,000 (2.40%), slipping under 300,000 for the first time since the 1860 census. The suburban population loss was less, at 4,000. The city’s loss was 66% of the metropolitan loss, more than six times its 10% share of the population.
Portland had the seventh largest loss (1.72%), dropping by 11,000. This is in contrast to Portland’s average population growth during the 2010s of 7,000. The suburbs grew by 10,000.
Chicago, with the eighth largest loss (1.65%) fell 45,000, to 2,697,000. The city’s loss was 42% of the metropolitan area loss, half again as large as Chicago’s 28% population share.
New Orleans also lost 1.65% (6,000), while the suburbs lost 4,000. The city’s loss was 62% of the metropolitan loss, more than double its 30% share of the population.
The 10th largest loss was in Philadelphia, at 1.55% (24,000), which contrasted with an 8,000 gain in the suburbs. Philadelphia is notable for being the only major metropolitan area in the Northeast with suburban population growth.
Other Trends
Core cities in tech hub metros experienced declining rates of growth. The losses in San Jose and Portland are described above.
The city of Austin added only 1,000 new residents (0.11%), a substantial drop from the average of 16,000 annual growth in the 2010s. This contrasts substantially with the population trend in the entire metropolitan area, which has maintained the fastest growth rate in the nation, despite the near zeroing out of city growth.
The city of Seattle had the largest percentage growth among the core cities between the 2010 and 2020 censuses. The average annual population growth was 16,000. Yet, Seattle lost 4,300 residents in 2021 (minus 0.58%), 59% of the metro loss. This was more that three times Seattle’s share of the metropolitan population.
Denver, which had averaged an annual population increase of 13,000 during the 2010s, lost 6,000 residents (minus 0.86%). The suburbs gained 15,000.
The core cities in the nation’s fourth and fifth largest metropolitan areas lost population (Dallas and Houston), Yet the metropolitan area growth was strong. Metro Dallas-Fort Worth had the largest gain in the nation, while metro Houston ranked third.
The second largest core city, Los Angeles, declined from 3,890,000 to 3,849,000, for a loss of 41,000 (minus 1.04%). The suburbs had a larger loss, at 163,000, the largest suburban loss among the major metropolitan areas. The city’s share of the metro loss, at 20%, was less than the city’s share of the population (30%). The adjacent Riverside-San Bernardino metropolitan area, which has typically drawn Los Angeles metro residents due, in part to lower house prices, added 53,000 new residents. This was the sixth largest increase, trailing only the four Texas metropolitan areas and Phoenix.
Encouraging Dispersion
The latest census population estimates indicate that the US population has dispersed even more rapidly during the pandemic. A principal reason is the adoption of remote work that made it possible for large parts of the economy to operate with less risk of infection. This also made it possible for many to obtain more living space, inside and outside where house prices are more affordable. It seems likely that remote and hybrid working will increase in the future, which along with higher housing affordability related cost of living differences will continue to sustain dispersion.
Wendell Cox is principal of Demographia, an international public policy firm located in the St. Louis metropolitan area. He is a founding senior fellow at the Urban Reform Institute, Houston, a Senior Fellow with the Frontier Centre for Public Policy in Winnipeg and a member of the Advisory Board of the Center for Demographics and Policy at Chapman University in Orange, California. He has served as a visiting professor at the Conservatoire National des Arts et Metiers in Paris. His principal interests are economics, poverty alleviation, demographics, urban policy and transport. He is co-author of the annual Demographia International Housing Affordability Survey and author of Demographia World Urban Areas.
Mayor Tom Bradley appointed him to three terms on the Los Angeles County Transportation Commission (1977-1985) and Speaker of the House Newt Gingrich appointed him to the Amtrak Reform Council, to complete the unexpired term of New Jersey Governor Christine Todd Whitman (1999-2002). He is author of War on the Dream: How Anti-Sprawl Policy Threatens the Quality of Life and Toward More Prosperous Cities: A Framing Essay on Urban Areas, Transport, Planning and the Dimensions of Sustainability.
Photo: San Antonio's downtown by Cristhian Rodriguez, via Wikimedia, in Public Domain.
Table 1 (back to reference)
| Core Cities and Suburbs: Population Estimates | ||||||||
| July 1, 2020 to July 1, 2021 | ||||||||
| Metropolitan Area | Rank | Historical Core Municipality | 2020 | 2021 | Core City Change | % Change | Suburban Change | Metro Population in Core City |
| Atlanta, GA | 34 | Atlanta | 499,586 | 496,461 | (3,125) | -0.63% | 57,360 | 8.1% |
| Austin, TX | 11 | Austin | 963,121 | 964,177 | 1,056 | 0.11% | 67,999 | 41.0% |
| Baltimore, MD | 28 | Baltimore | 583,132 | 576,498 | (6,634) | -1.14% | 451 | 20.3% |
| Birmingham, AL | 53 | Birmingham | 200,133 | 197,575 | (2,558) | -1.28% | 1,531 | 17.7% |
| Boston, MA-NH | 22 | Boston | 674,272 | 654,776 | (19,496) | -2.89% | (22,204) | 13.4% |
| Buffalo, NY | 47 | Buffalo | 277,908 | 276,807 | (1,101) | -0.40% | (3,465) | 23.8% |
| Charlotte, NC-SC | 15 | Charlotte | 876,747 | 879,709 | 2,962 | 0.34% | 37,755 | 32.6% |
| Chicago, IL-IN-WI | 3 | Chicago | 2,741,730 | 2,696,555 | (45,175) | -1.65% | (63,393) | 28.4% |
| Cincinnati, OH-KY-IN | 44 | Cincinnati | 310,113 | 308,935 | (1,178) | -0.38% | 4,229 | 13.7% |
| Cleveland, OH | 41 | Cleveland | 372,032 | 367,991 | (4,041) | -1.09% | (8,548) | 17.7% |
| Columbus, OH | 13 | Columbus | 905,860 | 906,528 | 668 | 0.07% | 11,423 | 42.1% |
| Dallas-Fort Worth, TX | 9 | Dallas | 1,303,234 | 1,288,457 | (14,777) | -1.13% | 137,005 | 16.6% |
| Denver, CO | 18 | Denver | 717,630 | 711,463 | (6,167) | -0.86% | 14,912 | 23.9% |
| Detroit, MI | 25 | Detroit | 638,176 | 632,464 | (5,712) | -0.90% | (21,124) | 14.5% |
| Fresno, CA | 30 | Fresno | 542,159 | 544,510 | 2,351 | 0.43% | 2,576 | 53.7% |
| Grand Rapids, MI | 54 | Grand Rapids | 198,173 | 197,416 | (757) | -0.38% | 4,785 | 18.1% |
| Hartford, CT | 56 | Hartford | 120,957 | 120,576 | (381) | -0.31% | (1,244) | 9.9% |
| Honolulu, HI | 42 | Honolulu | 349,800 | 345,510 | (4,290) | -1.23% | (11,328) | 34.5% |
| Houston, TX | 4 | Houston | 2,300,027 | 2,288,250 | (11,777) | -0.51% | 96,378 | 31.8% |
| Indianapolis, IN | 14 | Indianapolis | 887,382 | 882,039 | (5,343) | -0.60% | 21,107 | 41.5% |
| Jacksonville, FL | 12 | Jacksonville | 950,463 | 954,614 | 4,151 | 0.44% | 27,667 | 58.3% |
| Kansas City, MO-KS | 33 | Kansas City | 507,932 | 508,394 | 462 | 0.09% | 6,993 | 23.1% |
| Las Vegas, NV | 23 | Las Vegas | 643,292 | 646,790 | 3,498 | 0.54% | 23,517 | 28.2% |
| Los Angeles, CA | 2 | Los Angeles | 3,889,834 | 3,849,297 | (40,537) | -1.04% | (163,108) | 29.6% |
| Louisville, KY-IN | 26 | Louisville | 632,037 | 628,594 | (3,443) | -0.54% | 2,570 | 48.9% |
| Memphis, TN-MS-AR | 27 | Memphis | 631,326 | 628,127 | (3,199) | -0.51% | 1,523 | 47.0% |
| Miami, FL | 36 | Miami | 441,889 | 439,890 | (1,999) | -0.45% | (44,587) | 7.2% |
| Milwaukee,WI | 29 | Milwaukee | 576,301 | 569,330 | (6,971) | -1.21% | (1,273) | 36.3% |
| Minneapolis-St. Paul, MN-WI | 37 | Minneapolis | 429,014 | 425,336 | (3,678) | -0.86% | 3,929 | 11.5% |
| Nashville, TN | 20 | Nashville | 689,248 | 678,851 | (10,397) | -1.51% | 33,354 | 33.7% |
| New Orleans, LA | 40 | New Orleans | 383,282 | 376,971 | (6,311) | -1.65% | (3,808) | 29.9% |
| New York, NY-NJ-PA | 1 | New York | 8,772,978 | 8,467,513 | (305,465) | -3.48% | (66,547) | 42.8% |
| Virginia Beach-Norfolk, VA-NC | 48 | Norfolk | 237,591 | 235,089 | (2,502) | -1.05% | 6,156 | 13.0% |
| Oklahoma City, OK | 19 | Oklahoma City | 682,760 | 687,725 | 4,965 | 0.73% | 10,987 | 47.7% |
| Orlando, FL | 43 | Orlando | 307,603 | 309,154 | 1,551 | 0.50% | 16,998 | 11.5% |
| Philadelphia, PA-NJ-DE-MD | 6 | Philadelphia | 1,601,005 | 1,576,251 | (24,754) | -1.55% | 8,304 | 25.3% |
| Phoenix, AZ | 5 | Phoenix | 1,611,345 | 1,624,569 | 13,224 | 0.82% | 87,089 | 32.8% |
| Pittsburgh, PA | 45 | Pittsburgh | 302,777 | 300,431 | (2,346) | -0.77% | (15,046) | 12.8% |
| Portland, OR-WA | 24 | Portland | 652,388 | 641,162 | (11,226) | -1.72% | 9,979 | 25.5% |
| Providence, RI-MA | 55 | Providence | 190,101 | 189,692 | (409) | -0.22% | (396) | 11.3% |
| Raleigh, NC | 35 | Raleigh | 467,425 | 469,124 | 1,699 | 0.36% | 32,730 | 32.4% |
| Richmond, VA | 49 | Richmond | 226,670 | 226,604 | (66) | -0.03% | 9,694 | 17.1% |
| Rochester, NY | 51 | Rochester | 210,943 | 210,606 | (337) | -0.16% | (4,825) | 19.4% |
| Sacramento, CA | 32 | Sacramento | 523,416 | 525,041 | 1,625 | 0.31% | 12,421 | 21.8% |
| Salt Lake City, UT | 52 | Salt Lake City | 199,587 | 200,478 | 891 | 0.45% | 4,234 | 15.9% |
| San Antonio, TX | 7 | San Antonio | 1,438,227 | 1,451,853 | 13,626 | 0.95% | 30,019 | 55.8% |
| Riverside-San Bernardino, CA | 50 | San Berrnardino | 221,784 | 222,203 | 419 | 0.19% | 52,847 | 4.8% |
| San Diego, CA | 8 | San Diego | 1,385,394 | 1,381,611 | (3,783) | -0.27% | (8,782) | 42.0% |
| San Francisco, CA | 16 | San Francisco | 870,014 | 815,201 | (54,813) | -6.30% | (70,931) | 17.6% |
| San Jose, CA | 10 | San Jose | 1,010,908 | 983,489 | (27,419) | -2.71% | (20,864) | 50.4% |
| Seattle, WA | 17 | Seattle | 738,172 | 733,919 | (4,253) | -0.58% | (2,956) | 18.3% |
| St. Louis, MO-IL | 46 | St. Louis | 300,528 | 293,310 | (7,218) | -2.40% | (3,736) | 10.4% |
| Tampa-St. Petersburg, FL | 39 | Tampa | 383,980 | 387,050 | 3,070 | 0.80% | 41,169 | 12.0% |
| Tucson, AZ | 31 | Tucson | 541,859 | 543,242 | 1,383 | 0.26% | 7,214 | 51.6% |
| Tulsa, OK | 38 | Tulsa | 412,629 | 411,401 | (1,228) | -0.30% | 9,885 | 40.2% |
| Washington, DC-VA-MD-WV | 21 | Washington | 690,093 | 670,050 | (20,043) | -2.90% | (8,685) | 10.5% |
| Total | 49,216,967 | 48,599,659 | (617,308) | -1.25% | 349,940 | 25.7% | ||
| Data from United States Census Bureau | ||||||||
| Historical Core Municipalities: See https://www.newgeography.com/content/004453-urban-cores-core-cities-and-principal-cities | ||||||||


