
Anyone who challenges the notion that the long predicted exodus of people from the suburbs to the city has been wildly overstated is sure to generate some backlash from urban boosters. Alan Berube of the Brookings Institution contends in a New Republic column that "head counts" better reveal city trends than property trends or the massive condo bust. He points to a Brookings Institution analysis by Bill Frey, entitled "Texas Gains, Suburbs Lose in 2010 Census Review," which compares trends in major cities and suburbs, but offers not a sentence demonstrating any actual population “loss” in suburbs (his point is that their growth rates have declined).
However, Berube has a point. Head counts are the issue. The annual Bureau of the Census "head count" of domestic migration reveals that the suburban to urban core exodus is as elusive as it has ever been. Gross population totals reveal nothing with respect to movements between the suburbs and the core. There is no doubt that core city population trends have improved, and this is a good thing. However, there is not a shred of evidence that suburbanites are picking up and moving to the cores.
Domestic Migration: This is indicated by a "head count" of migration trends during the decade and during the last year. Each year, the Bureau of the Census estimates the number of people who move between counties (domestic migration) and the number of people who move into metropolitan areas from outside the nation (international migration). The data is estimated at the county (equivalent) level, which means that, except where cities are counties (such as Baltimore, San Francisco and others), individual core city data is not available. Thus, the analysis has to rely on core versus suburban counties in metropolitan areas (Note 1).
In short, the nation's urban cores continue to lose domestic migrants with a vengeance, however are doing quite well at attracting international migration. Thus, core growth is not resulting from migration from suburbs or any other part of the nation, but is driven by international migration.
The following analysis covers all but four (48) metropolitan areas with more than 1,000,000 population as of 2009. San Diego, Las Vegas and Tucson are excluded because they include only one county, so there is only a core county and no suburban county. New Orleans is excluded due to the special circumstances of the huge population losses from Hurricane Katrina.
Generally, domestic migrants are leaving the nation's largest metropolitan areas. Between 2000 and 2009, a net 1,900,000 domestic migrants moved to areas of the nation outside the largest metropolitan areas (Table 1). Domestic migration losses occurred 24 of the 48 metropolitan areas. In the last year (2008-2009), the net domestic out-migration for all 48 regions in total was 22,000, 90% below the 2000-2008 annual rate. A somewhat smaller number of metropolitan areas, 22, experienced domestic migration losses in the last year. Most observers, including Berube, trace this diminishing loss to the recession, which has made movement in any direction more difficult over the past two years.
| Table 1 | |||||||
| Domestic Migration: Major Metropolitan Areas | |||||||
|
2000-2009
|
2008-2009
|
||||||
|
Core County Classification
|
Metropolitan Area
|
Metropolitan Area
|
Core
|
Suburban
|
Metropolitan Area
|
Core
|
Suburban
|
|
1
|
New York | (1,920,745) | (1,222,290) | (698,455) | (110,278) | (77,381) | (32,897) |
|
3
|
Los Angeles | (1,337,522) | (1,102,202) | (235,320) | (79,900) | (76,674) | (3,226) |
|
2
|
Chicago | (547,430) | (705,403) | 157,973 | (40,389) | (31,114) | (9,275) |
|
4
|
Dallas-Fort Worth | 307,907 | (262,982) | 570,889 | 45,241 | (7,494) | 52,735 |
|
1
|
Philadelphia | (112,071) | (154,338) | 42,267 | (7,577) | (5,496) | (2,081) |
|
4
|
Houston | 242,573 | (69,736) | 312,309 | 49,662 | 19,002 | 30,660 |
|
4
|
Miami-West Palm Beach | (284,860) | (297,637) | 12,777 | (29,321) | (25,142) | (4,179) |
|
1
|
Washington | (110,775) | (39,814) | (70,961) | 18,189 | 4,454 | 13,735 |
|
3
|
Atlanta | 412,832 | 3,243 | 409,589 | 17,479 | 7,579 | 9,900 |
|
1
|
Boston | (232,984) | (100,485) | (132,499) | 6,813 | (32) | 6,845 |
|
2
|
Detroit | (361,632) | (306,467) | (55,165) | (45,488) | (34,794) | (10,694) |
|
4
|
Phoenix | 530,579 | 404,840 | 125,739 | 12,441 | 4,651 | 7,790 |
|
2
|
San Francisco-Oakland | (343,834) | (245,796) | (98,038) | 7,977 | (207) | 8,184 |
|
4
|
Riverside-San Bernardino | 457,430 | 375,055 | 82,375 | (616) | 13,174 | (13,790) |
|
3
|
Seattle | 42,424 | (27,407) | 69,831 | 17,035 | 11,053 | 5,982 |
|
2
|
Minneapolis-St. Paul | (22,865) | (138,395) | 115,530 | (2,503) | (1,989) | (514) |
|
1
|
St. Louis | (42,151) | (62,990) | 20,839 | (4,532) | (3,197) | (1,335) |
|
4
|
Tampa-St. Petersburg | 254,650 | 89,385 | 165,265 | 4,663 | 2,630 | 2,033 |
|
1
|
Baltimore | (35,938) | (74,328) | 38,390 | (3,687) | (4,883) | 1,196 |
|
2
|
Denver | 61,108 | (44,839) | 105,947 | 19,831 | 6,369 | 13,462 |
|
2
|
Pittsburgh | (49,438) | (57,532) | 8,094 | 1,144 | 401 | 743 |
|
2
|
Portland | 120,437 | 3,811 | 116,626 | 16,320 | 7,053 | 9,267 |
|
2
|
Cincinnati | (18,313) | (87,976) | 69,663 | (384) | (2,833) | 2,449 |
|
4
|
Sacramento | 135,038 | 32,369 | 102,669 | 4,733 | (1,185) | 5,918 |
|
2
|
Cleveland | (133,679) | (151,448) | 17,769 | (10,191) | (10,875) | 684 |
|
4
|
Orlando | 218,108 | 46,341 | 171,767 | (4,279) | (6,275) | 1,996 |
|
4
|
San Antonio | 175,552 | 96,856 | 78,696 | 18,984 | 10,797 | 8,187 |
|
3
|
Kansas City | 30,181 | (33,910) | 64,091 | 3,929 | (417) | 4,346 |
|
4
|
San Jose | (233,133) | (226,545) | (6,588) | (5,361) | (4,829) | (532) |
|
3
|
Columbus | 32,087 | (36,024) | 68,111 | 5,018 | 1,907 | 3,111 |
|
4
|
Charlotte | 243,399 | 104,402 | 138,997 | 19,211 | 8,299 | 10,912 |
|
3
|
Indianapolis | 70,271 | (53,039) | 123,310 | 7,034 | (1,209) | 8,243 |
|
4
|
Austin | 224,227 | 52,842 | 171,385 | 25,654 | 10,484 | 15,170 |
|
2
|
Norfolk-Virginia Beach | (19,172) | (19,391) | 219 | (8,052) | (3,559) | (4,493) |
|
2
|
Providence | (50,151) | (38,129) | (12,022) | (6,736) | (4,939) | (1,797) |
|
3
|
Nashville | 120,684 | (20,101) | 140,785 | 10,826 | 128 | 10,698 |
|
2
|
Milwaukee | (72,668) | (89,476) | 16,808 | (2,336) | (3,585) | 1,249 |
|
4
|
Jacksonville | 125,881 | 17,866 | 108,015 | 1,758 | (3,415) | 5,173 |
|
4
|
Memphis | (8,834) | (61,325) | 52,491 | (5,276) | (7,867) | 2,591 |
|
3
|
Louisville | 33,700 | (7,692) | 41,392 | 2,122 | 262 | 1,860 |
|
2
|
Richmond | 74,650 | (4,839) | 79,489 | 2,751 | 3 | 2,748 |
|
3
|
Oklahoma City | 41,523 | (8,164) | 49,687 | 8,798 | 3,236 | 5,562 |
|
3
|
Hartford | (9,385) | (22,089) | 12,704 | (1,847) | (1,949) | 102 |
|
3
|
Birmingham | 26,420 | (26,550) | 52,970 | 2,418 | (1,424) | 3,842 |
|
3
|
Salt Lake City | (32,760) | (43,779) | 11,019 | (164) | (911) | 747 |
|
4
|
Raleigh | 190,438 | 150,583 | 39,855 | 20,095 | 16,070 | 4,025 |
|
2
|
Buffalo | (53,191) | (47,780) | (5,411) | (1,711) | (1,806) | 95 |
|
2
|
Rochester | (42,163) | (35,354) | (6,809) | (1,937) | (1,224) | (713) |
| Total | (1,903,595) | (4,548,659) | 2,645,064 | (22,439) | (199,153) | 176,714 | |
| Major metropolitan areas: Population over 1,000,000 in 2009 | |||||||
| Core county classifications: See Table 2 | |||||||
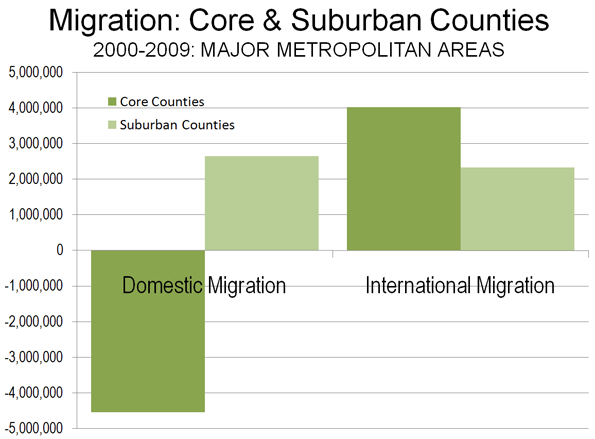
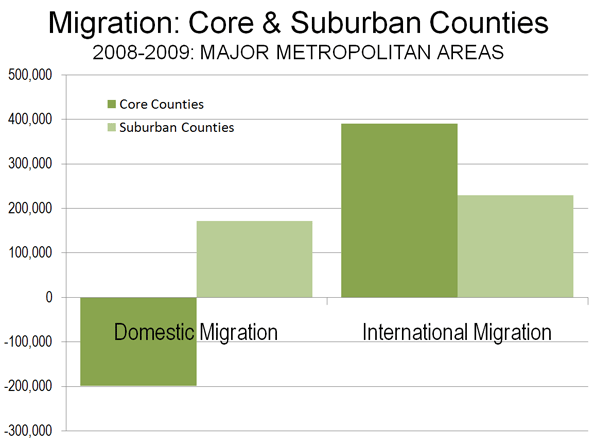
The core counties lost domestic migrants, often at very high rates. Between 2000 and 2009, more than 4,500,000 people moved out of the core counties. This is more people than live in the cities of Los Angeles and Washington, DC combined. The suburban counties did substantially better gaining more than 2,600,000 domestic migrants (nearly as many people as live in the city of Chicago), but not enough to negate the core losses. Over the past year, the core counties lost 200,000 domestic migrants, an annual rate approximately two-thirds less than the rate from 2000 to 2008. Suburban counties gained 175,000, a more than 40% reduction from the 2000-2008 annual rate. All of these rate changes are consistent with expectations in a recession, as fewer people move.
If anything, the trends of the past decade indicate a further dispersal of America's metropolitan population, with an additional 200,000 domestic migrants moving to the exurban counties adjacent to and beyond the major metropolitan areas (Note 2). Reflecting the effects of the recession, exurban areas lost 4,000 domestic migrants in the last year. This one year loss rate is less than 1/10th of the core county domestic migration loss rate over the same period. Another nearly 1.7 million domestic migrants left the major metropolitan areas and their exurbs altogether, moving to smaller metropolitan areas, smaller urban areas and rural areas.
Between 2000 and 2008, 36 cores experienced domestic migration losses, compared to 10 suburban areas. The cores did better in the last year, with 29 losing domestic migrants, while 13 suburban areas lost domestic migrants. Further, more people moved into (or fewer moved out of) the suburbs from other parts of the country than to the cores in 42 of the 48 metropolitan areas between 2000 and 2009 and in 2008-2009.
Moreover, not all urban cores are the same. Some, including most of the fast growing areas, are far more suburban than others. This is illustrated by a classification of core counties (Table 2) based upon the share of owner occupant housing built after 1949 (For for statistical purposes the beginning of automobile oriented suburbanization was with the census of 1950).
| Table 2 | |
| Core County Classifications (Extent of Suburbanization) | |
|
Core County Classification
|
Share of Owner-Occupied Houses Built After 1949
|
| Dominant Urban Cores |
Less than 50%
|
| Moderately Suburban |
50% = <75%
|
| Substantially Suburban |
70% = <85%
|
| Predominantly Suburban |
85% & Over
|
| Data from 2000 US Census | |
For example, in the core counties of the St. Louis and Boston metropolitan areas, there is little suburbanization, with more than 70% of houses having been built before 1950. Their growth truly reflects the attractiveness of traditional, relatively dense urban living. On the other hand, in the core county of the Austin metropolitan area, less than 10% of the houses were built before 1950, while in Phoenix, the figure is 3%. In these and other core counties that encompass large suburban areas, the vast majority of “urban” growth follows a highly suburbanized, auto-oriented model.
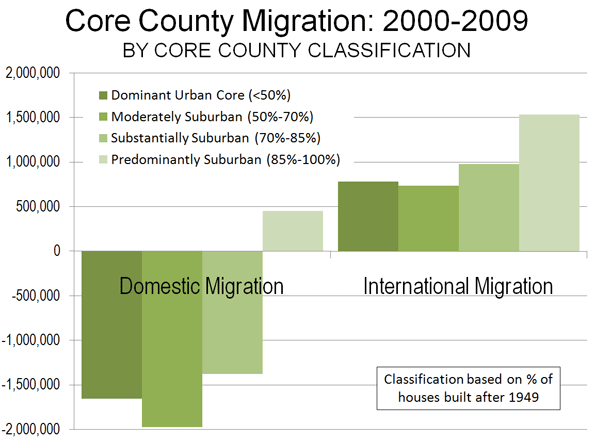
The domestic migration results by core county classification are as follows:
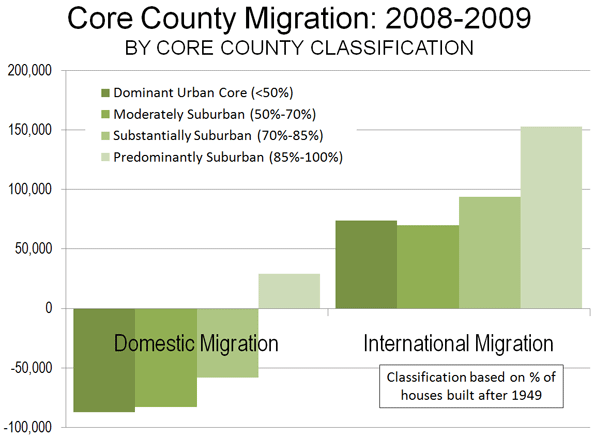
- Dominant Urban Core Central Counties (less than 50% of the housing stock built after 1949) lost 1.650 million domestic migrants, or 14.0% of their 2000 population. In the last year, the loss was 87,000.
- Moderately Suburban Core Central Counties (50% to 69% of the housing stock built after 1949) lost 1.970 million domestic migrants, or 10.0% of their 2000 population. In the last year, the loss was 83,000.
- Substantially Suburban Core Central Counties (70% to 84% of the housing stock built after 1949) lost 1.380 million domestic migrants, or 7.2% of their 2000 population. In the last year, the loss was 58,000.
- Predominantly Suburban Core Central Counties (85% and more of the housing stock built after 1949) gained 450 thousand domestic migrants, or 2.0% of their 2000 population. In the last year, the gain was 29,000.
By no stretch of the imagination, then, can it be validly claimed that the overall trend is people moving from the suburbs to the core. The evidence suggests that the more urban the core county, the greater are the domestic migration losses.
International Migration: The real story with respect to core growth is international migration. The 48 metropolitan areas gained 6.4 million international migrants from 2000 to 2009 and 620,000 in 2008-2009. International migration, also impacted by recession, dropped by nearly a 15% drop from the 2000-2008 annual rate (Table 3).
| Table 3 | |||||||
| International Migration: Major Metropolitan Areas | |||||||
|
2000-2009
|
2008-2009
|
||||||
|
Core County Classification
|
Metropolitan Area
|
Metropolitan Area
|
Core
|
Suburban
|
Metropolitan Area
|
Core
|
Suburban
|
|
1
|
New York | 1,075,016 | 622,538 | 452,478 | 100,669 | 57,674 | 42,995 |
|
3
|
Los Angeles | 803,614 | 628,303 | 175,311 | 75,062 | 58,557 | 16,505 |
|
2
|
Chicago | 363,134 | 265,156 | 97,978 | 33,363 | 24,236 | 9,127 |
|
4
|
Dallas-Fort Worth | 323,941 | 203,732 | 120,209 | 31,571 | 19,785 | 11,786 |
|
1
|
Philadelphia | 122,733 | 50,761 | 71,972 | 12,944 | 5,560 | 7,384 |
|
4
|
Houston | 289,648 | 252,098 | 37,550 | 27,996 | 24,371 | 3,625 |
|
4
|
Miami-West Palm Beach | 506,423 | 318,888 | 187,535 | 51,548 | 32,380 | 19,168 |
|
1
|
Washington | 310,222 | 23,112 | 287,110 | 31,904 | 2,096 | 29,808 |
|
3
|
Atlanta | 207,238 | 42,082 | 165,156 | 20,288 | 4,093 | 16,195 |
|
1
|
Boston | 191,014 | 64,359 | 126,655 | 19,250 | 6,522 | 12,728 |
|
2
|
Detroit | 93,625 | 44,177 | 49,448 | 8,723 | 4,132 | 4,591 |
|
4
|
Phoenix | 214,067 | 209,326 | 4,741 | 21,833 | 21,364 | 469 |
|
2
|
San Francisco-Oakland | 257,318 | 161,324 | 95,994 | 24,376 | 15,373 | 9,003 |
|
4
|
Riverside-San Bernardino | 90,652 | 46,829 | 43,823 | 8,464 | 4,313 | 4,151 |
|
3
|
Seattle | 126,973 | 98,983 | 27,990 | 12,919 | 9,971 | 2,948 |
|
2
|
Minneapolis-St. Paul | 84,440 | 69,262 | 15,178 | 8,234 | 6,756 | 1,478 |
|
1
|
St. Louis | 29,782 | 11,794 | 17,988 | 2,928 | 1,112 | 1,816 |
|
4
|
Tampa-St. Petersburg | 74,173 | 42,568 | 31,605 | 8,045 | 4,762 | 3,283 |
|
1
|
Baltimore | 43,949 | 10,852 | 33,097 | 4,604 | 1,125 | 3,479 |
|
2
|
Denver | 93,916 | 45,338 | 48,578 | 8,738 | 4,251 | 4,487 |
|
2
|
Pittsburgh | 19,225 | 16,326 | 2,899 | 1,901 | 1,596 | 305 |
|
2
|
Portland | 70,901 | 28,755 | 42,146 | 6,680 | 2,677 | 4,003 |
|
2
|
Cincinnati | 22,364 | 12,754 | 9,610 | 2,245 | 1,260 | 985 |
|
4
|
Sacramento | 64,275 | 47,169 | 17,106 | 6,056 | 4,420 | 1,636 |
|
2
|
Cleveland | 28,002 | 20,168 | 7,834 | 2,826 | 1,987 | 839 |
|
4
|
Orlando | 95,500 | 61,171 | 34,329 | 11,720 | 7,381 | 4,339 |
|
4
|
San Antonio | 31,595 | 28,157 | 3,438 | 3,303 | 2,940 | 363 |
|
3
|
Kansas City | 34,339 | 12,613 | 21,726 | 3,404 | 1,262 | 2,142 |
|
4
|
San Jose | 170,452 | 168,009 | 2,443 | 16,347 | 16,116 | 231 |
|
3
|
Columbus | 39,755 | 38,261 | 1,494 | 4,063 | 3,915 | 148 |
|
4
|
Charlotte | 48,176 | 34,522 | 13,654 | 4,678 | 3,332 | 1,346 |
|
3
|
Indianapolis | 27,676 | 22,058 | 5,618 | 2,809 | 2,239 | 570 |
|
4
|
Austin | 65,958 | 56,828 | 9,130 | 6,406 | 5,516 | 890 |
|
2
|
Norfolk-Virginia Beach | 421 | (1,546) | 1,967 | 867 | 81 | 786 |
|
2
|
Providence | 34,926 | 25,547 | 9,379 | 3,753 | 2,741 | 1,012 |
|
3
|
Nashville | 36,570 | 26,208 | 10,362 | 3,850 | 2,760 | 1,090 |
|
2
|
Milwaukee | 26,814 | 22,612 | 4,202 | 2,706 | 2,292 | 414 |
|
4
|
Jacksonville | 15,066 | 12,046 | 3,020 | 1,760 | 1,397 | 363 |
|
4
|
Memphis | 19,845 | 17,801 | 2,044 | 2,093 | 1,874 | 219 |
|
3
|
Louisville | 16,437 | 12,778 | 3,659 | 1,685 | 1,291 | 394 |
|
2
|
Richmond | 17,061 | 4,161 | 12,900 | 1,805 | 440 | 1,365 |
|
3
|
Oklahoma City | 23,717 | 18,698 | 5,019 | 2,394 | 1,878 | 516 |
|
3
|
Hartford | 30,266 | 25,871 | 4,395 | 3,230 | 2,784 | 446 |
|
3
|
Birmingham | 14,485 | 10,644 | 3,841 | 1,557 | 1,151 | 406 |
|
3
|
Salt Lake City | 41,216 | 39,416 | 1,800 | 3,855 | 3,684 | 171 |
|
4
|
Raleigh | 36,923 | 32,141 | 4,782 | 3,560 | 3,103 | 457 |
|
2
|
Buffalo | 9,671 | 8,387 | 1,284 | 940 | 814 | 126 |
|
2
|
Rochester | 12,796 | 11,657 | 1,139 | 1,243 | 1,123 | 120 |
| Total | 6,356,310 | 4,024,694 | 2,331,616 | 621,195 | 390,487 | 230,708 | |
| Major metropolitan areas: Population over 1,000,000 in 2009 | |||||||
| Core county classifications: See Table 2 | |||||||
The core counties gained 4.0 million net international migrants between 2000 and 2009. The international migration gains in the dominant urban and moderately suburban core counties were not sufficient to compensate for the domestic migration losses (Figure 3). Surprisingly, the strongest gain in international migration from 2000 to 2009 was not in the more urban core counties, but rather was in the predominantly suburban core counties, at a 6.8% rate compared to 2000 populations.
In 2008-2009, the core county gain was 390,000, approximately 15% below the 2000-2008 annual rate (Figure 4). The suburban counties gained international migrants, though fewer than the cores, adding a net 2.3 million between 2000 and 2009. Between 2008 and 2009, the suburbs added a net 230,000 international migrants, a 12% decline from the 2000-2008 annual rate.
This of course measures only initial international migration. Over time many immigrants likely will head for the suburbs, which now are home to a majority. Core cities may be playing more of a “revolving door" role where they take in immigrants (and young people) for several years, then lose them, but replace the loss with newcomers.
The Exodus: Elusive as Ever: The much ballyhooed suburban hegira has not begun, despite it having been announced repeatedly (Table 4). There is no doubt that the cores are doing better than in recent decades, particularly since the deep recession began. But the relative better urban performance may have more to do with stagnation than anything endlessly alluring about inner city life.
| Table 4 | ||||||
| Domestic, International & Total Migration: Major Metropolitan Areas | ||||||
|
PERSONS
|
Net Domestic Migration: 2000-2009
|
Net Domestic Migration: 2008-2009
|
Net International Migration: 2000-2009
|
Net International Migration: 2008-2009
|
Net Total Migration: 2000-2009
|
Net Total Migration: 2008-2009
|
| Core Counties (Share of Post-1949 Housing) | (4,548,659) | (199,153) | 4,024,694 | 390,487 | (523,965) | 191,334 |
| Dominant Urban Core (Less than 50%) | (1,654,245) | (86,535) | 783,416 | 74,089 | (870,829) | (12,446) |
| Moderately Suburban (50%-69% | (1,969,014) | (83,099) | 734,078 | 69,759 | (1,234,936) | (13,340) |
| Substantially Suburban (70%-84%) | (1,377,714) | (58,419) | 975,915 | 93,585 | (401,799) | 35,166 |
| Predominantly Suburban (85% & Over) | 452,314 | 28,900 | 1,531,285 | 153,054 | 1,983,599 | 181,954 |
| Suburban Counties | 2,645,064 | 176,714 | 2,331,616 | 230,708 | 4,976,680 | 407,422 |
| 48 Major Metropolitan Areas | (1,903,595) | (22,439) | 6,356,310 | 621,195 | 4,452,715 | 598,756 |
| Exurban Counties | 198,294 | (4,053) | 364,498 | 36,740 | 562,792 | 32,687 |
| 48 Metropolitan Areas & All Exurban Counties | (1,705,301) | (26,492) | 6,720,808 | 657,935 | 5,015,507 | 631,443 |
| 4 Excluded Metropolitan Areas | 19,958 | 14,553 | 225,767 | 23,400 | 245,725 | 37,953 |
| All (52) Major Metropolitan Areas & Exurban Counties | (1,685,343) | (11,939) | 6,946,575 | 681,335 | 5,261,232 | 669,396 |
| Smaller Metropolitan & Rural | 1,685,343 | 11,939 | 1,678,369 | 173,570 | 3,363,712 | 185,509 |
| United States | 0 | 0 | 8,624,944 | 854,905 | 8,624,944 | 854,905 |
| Major metropolitan areas: Population over 1,000,000 in 2009 | ||||||
| Excluded metropolitan areas: San Diego, Las Vegas & Tucson (no suburban county) and New Orleans (due to Hurricane Katrina) | ||||||
| Exurban counties of excluded metropolitan areas are included (Las Vegas and New Orleans) | ||||||
As in Europe, people are moving to the urban cores. But also, as in Europe, they are moving there from across national borders, rather than from the suburbs (Figures 3 & 4). This will surprise urbanites who cannot imagine meaningful lives in the suburbs, but will not shock the many millions more suburban residents content enough not to move. The exodus from the suburbs to the core will not have begun until more moving vans head away from the suburbs than to them. To this point, this is simply not occurring. And when the economy recovers, history suggests that the gap between suburban and core growth rates may begin expanding again.
Note: There is one core county in each metropolitan area, which is the county containing the first named city, except for in New York, where all five counties (boroughs) are included, in San Francisco-Oakland, where Alameda County (Oakland) is also included and in Minneapolis-St. Paul, where Ramsey County (St. Paul) is also included.
Note: The exurban counties are those included in combined statistical areas (as designated by the Bureau of the Census), which have major metropolitan areas as their core.
Photo: Suburban Minneapolis-St. Paul
Wendell Cox is a Visiting Professor, Conservatoire National des Arts et Metiers, Paris. He was born in Los Angeles and was appointed to three terms on the Los Angeles County Transportation Commission by Mayor Tom Bradley. He is the author of "War on the Dream: How Anti-Sprawl Policy Threatens the Quality of Life.”


St. Louis, City of
Thank you for the question. Central county is the city of STL. All central counties (or county equivalents) are the location of the core city, except in NYC, where all 5 NYC counties are included and two places with two counties: SF & Oakland and Minneapolis and St. Paul.
The numbers shown are for the city of STL.
Best regards
Wendell Cox
Demographia
www.demographia.com