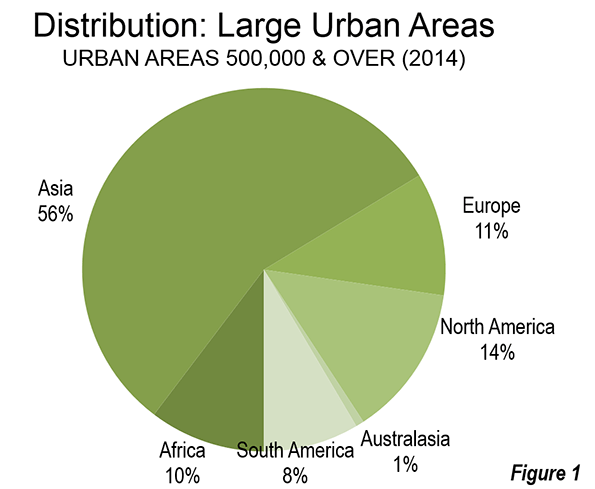
The recently released 10th edition of Demographia World Urban Areas provides estimated population, land area and population density for the 922 identified urban areas with more than 500,000 population. With a total population of 1.92 billion residents, these cities comprise approximately 51 percent of the world urban population. The world's largest cities are increasingly concentrated in Asia, where 56 percent are located. North America ranks second to Asia, with only 14 percent of the largest cities (Figure 1). Only three high income world cities are ranked in the top ten (Tokyo, Seoul and New York) and with present growth rates, Tokyo will be the lone high-income representative by the middle 2020s.
Demographia World Urban Areas is the only regularly published compendium of urban population, land area and density data for cities of more than 500,000 population. Moreover, the populations are matched to the urban land areas where sufficient data is available from national census authorities.
The City
The term "city" has two principal meanings. One is the "built-up urban area," which is the city in its physical form, encompassing virtually all of the land area encircled by rural land or bodies of water. Demographia World Urban Areas reports on cities as built-up urban areas, using the following definition (Note 1).
An urban area is a continuously built up land mass of urban development that is within a labor market (metropolitan area or metropolitan region). As a part of a labor market, an urban area cannot cross customs controlled boundaries unless the virtually free movement of labor is permitted. An urban area contains no rural land (all land in the world is either urban or rural).
The other principal definition is the labor market, or metropolitan area, which is the city as the functional (economic) entity. The metropolitan area includes economically connected rural land to the outside of the built-up up urban area (and may include smaller urban areas). The third use, to denote a municipal corporation (such as the city of New York or the city of Toronto) does not correspond to the city as a built-up urban area or metropolitan area. This can – all too often does – cause confusion among analysts and reporters who sometimes compare municipalities to metropolitan areas or to built-up urban areas.
A Not Particularly Dense Urban World
Much has been made of the fact that more than one-half of humanity lives in urban areas, for the first time in history. Yet much of that urbanization is not of the high densities associated with cities like Dhaka, New York, or even Atlanta.
The half of the world's urban population not included in Demographia World Areas lives in cities ranging in population from the hundreds to the hundreds of thousands (see: What is a Half-Urban World). In the high income world, residents of large urban areas principally live at relatively low densities, with automobile oriented suburbanization accounting for much of the urbanization in Western Europe, North America, Japan and Australasia. This point was well illustrated in research by David L. A. Gordon et al at Queen's University (Kingston, Ontario), released last year which concluded that the metropolitan areas of Canada are approximately 80 percent suburban.
Population
There are now 29 megacities, with the addition in the last year of London. London might be thought of as having been a megacity for decades, however the imposition of its greenbelt forced virtually all growth since 1939 to exurban areas that are not a part of the urban area, keeping its population below the 10 million threshold until this year (Demographia World Urban Areas Table 1).
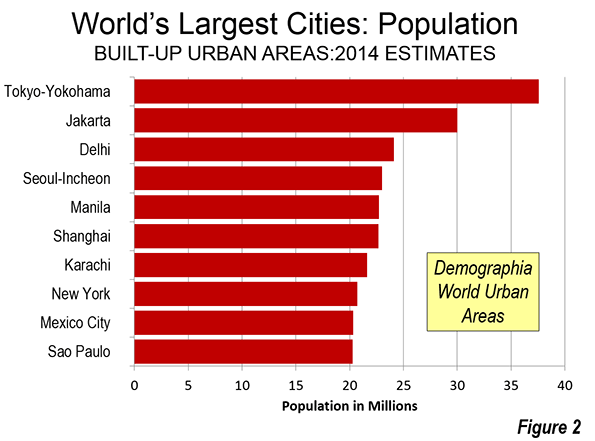
The largest 10 contain the same cities as last year, though there have been ranking changes. Tokyo, with 37.6 million residents, continues its half century domination, though its margin over growing developing world cities is narrowing, especially Jakarta. Manila became the fifth largest urban area in the world, displacing Shanghai, while Mexico City moved up to 9th, displacing Sao Paulo (Figure 2).
Land Area
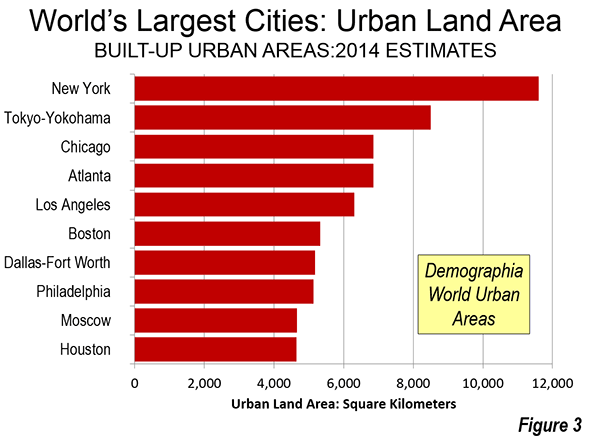
Often seen as the epitome of urban density, the urban area of New York continues to cover, by far, the most land area of any city in the world. Its land area of nearly 4,500 square miles (11,600 square kilometers) is one-third higher than Tokyo's 3,300 (8,500 square kilometers). Los Angeles, which is often thought of as defining low-density territorial expansion ranks only fifth, following Chicago and Atlanta, with their substantially smaller populations (Figure 3). Perhaps more surprisingly is the fact that Boston has the sixth largest land area of any city in the world. Boston's strong downtown (central business district) and relatively dense core can result in a misleading perception of high urban density. In fact, Boston's post-World War II suburbanization is at urban densities little different than that of Atlanta, which is the world's least dense built-up urban area with more than 3 million population. Now, 29 cities cover land areas of more than 1,000 square miles or 2,500 square kilometers (Demographia World Urban Areas Table 3).
Urban Density
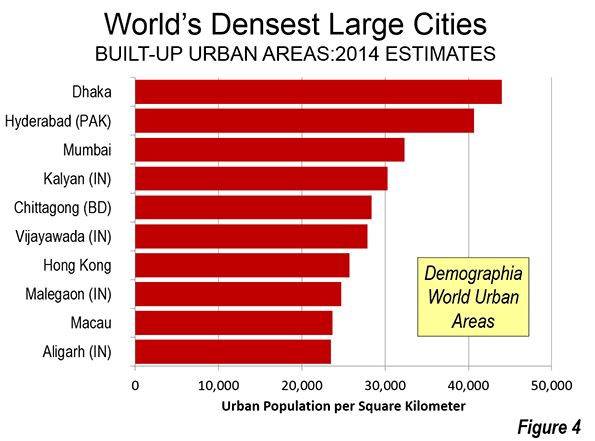
All but two of the 10 densest cities are on the Indian subcontinent. Dhaka continues to lead in density, with 114,000 residents per square mile (44,000 per square kilometer). Hyderabad (Pakistan, not India) ranks a close second. Mumbai and nearby Kalyan (Maharashtra) are the third and fourth densest cities. Hong Kong and Macau are the only cities ranking in the densest ten outside the subcontinent (Figure 4). Despite its reputation for high urban densities, the highest ranking city in China (Henyang, Hunan) is only 39th (Demographia World Urban Areas Table 4).
Smaller Urban Areas
Demographia World Urban Areas Table 2 includes more than 700 additional cities with fewer than 500,000 residents, mainly in the high income world. Unlike the main listing of urban areas over 500,000 population, the smaller cities do not represent a representative sample, and are shown only for information.
Density by Geography
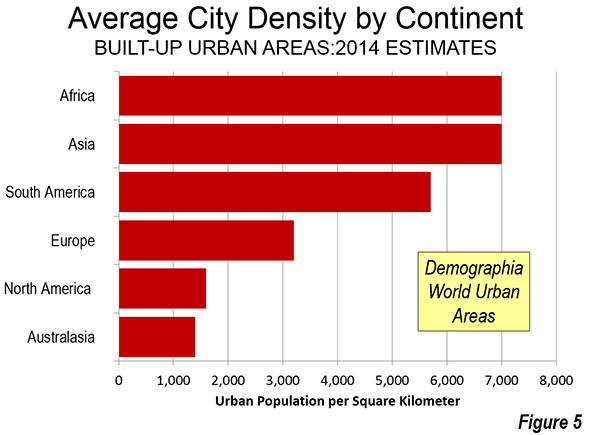
Demographia World Urban Areas also provides an average built-up urban area density for a number of the geographical areas. Africa and Asia had the highest average city densities, at 18,000 per square mile (7,000 per square kilometer), followed by South America. Europe was in the middle, while North America and Oceania have the lowest average city densities (Figure 5).
Some geographies, however, had much higher average urban densities. Bangladesh was highest, at 86,800 per square mile (33,000 per square kilometer), nearly five times the Asian average. Other geographies above 30,000 per square mile (11,500 per square kilometer) included Pakistan, the Democratic Republic of the Congo, the Philippines, India and Colombia, the only representative from the Western Hemisphere (Demographia World Urban Areas Table 5).
Wendell Cox is principal of Demographia, an international public policy and demographics firm. He is co-author of the "Demographia International Housing Affordability Survey" and author of "Demographia World Urban Areas" and "War on the Dream: How Anti-Sprawl Policy Threatens the Quality of Life." He was appointed to three terms on the Los Angeles County Transportation Commission, where he served with the leading city and county leadership as the only non-elected member. He was appointed to the Amtrak Reform Council to fill the unexpired term of Governor Christine Todd Whitman and has served as a visiting professor at the Conservatoire National des Arts et Metiers, a national university in Paris.
----------------------
Note 1: Urban areas are called also called "population centres" (Canada), "built-up urban areas" (United Kingdom, "urbanized areas' (United States), "unités urbaines" (France) and "urban centres" (Australia). The "urban areas" of New Zealand include rural areas, as do many of the areas designated "urban" in the People's Republic of China, and, as a result, do not meet the definition of urban areas above.
Note 2: Demographia World Urban Areas is a continuing project. Revisions are made as more accurate satellite photographs and population estimates become available. As a result, the data in Demographia World Urban Areas is not intended for comparison to prior years, but is intended to be the latest data based upon the best data sources available at publication.
Photograph: Slum, Valenzuela City, Manila (by Author)


