
"By 1970, the governments of the wealthy countries began to take it for granted that they had truly discovered the secret of cornucopia. Politicians of left and right alike believed that modern economic policy was able to keep economies expanding very fast -- and endlessly. That left only the congenial question of dividing up the new wealth that was being steadily generated."
Those words, from a Washington Post editorial more than twenty-five years ago, echoed the beliefs not only of politicians and the press, but of mainstream economics professionals resistant to the idea that growth in a market economy would ever stagnate over a protracted period.
And some of the data did fit nicely. Through several recessions and recoveries, inflation-adjusted GDP rose almost in tandem with a line of predicted growth expectations. But in November 2007, something changed. Real GDP dropped down from what was expected by more than 11 percent, and, as this summer's data has shown, it hasn't returned to its pre-recession trend.
The unusual slump has provoked a stream of commentary that attempts to define the problem, but it hardly matters whether the downturn is identified as the second dip of a 'double-dip' recession, a continuation of the 'Great Recession', a fast-moving slowdown, a slow nosedive, a long-term stall-out, or a confirmation that the economy has entered a Japanese-style 'lost decade'. Growth during the 21st century is following a different trend line than it did in the 20th, and employment is also responding in new, different ways from earlier post-World War II recessions.
A range of additional data also indicates that what we're hearing is not the regular breathing of an economy as it contracts and expands. Annual growth rates and quarterly moving averages — when examined starting in the mid 1970s, as Greg Hannsgen and I did at the Levy Economics Institute — show a steady decline beginning in 2000.
And the employment numbers make the case yet again. Look at the graph below, with separate lines for the past six recessions. It traces employment-to-population ratios, beginning with the first month of each recession. These ratios are used to measure, among other things, how well a nation utilizes its workforce— a kind of labor drop-out rate.
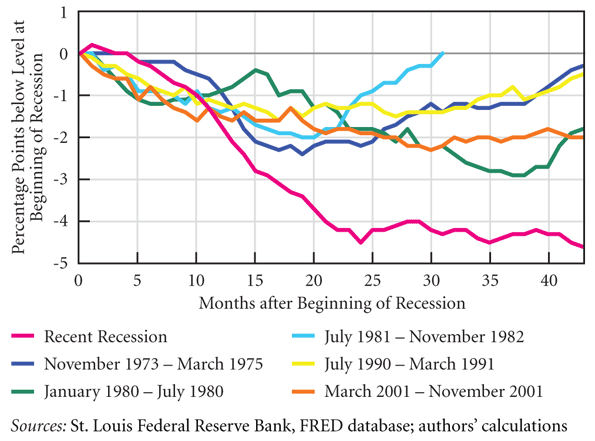
You can see at a glance that the pink line indicating the current recession — yes, that one down near the bottom of the chart — is an outlier in the group. It shows that by the 43rd month of the downturn, the ratio stood at just over 58 percent, meaning that 58 percent of the population was employed. That figure is 4.6 percent less than at the recession's start, when more than 62 percent were working. And it means that this employment decline is steeper, deeper, and longer than in any of the previous five recessions by a long shot.
Even in the two worst recoveries during the past forty years, this ratio never before declined by more than three percent. By the time the five recessions were this far along, employment had returned either to pre-recession levels, or to a distance from the recession's start that was, at worst, two percent, compared to the current more than four percent.
Together, this data makes the case that we're in a prolonged slump that's highly unusual, and requires action that's far more aggressive than the usual responses. Job creation should be the government's urgent, first priority. The nation needs to recognize just how perilous the employment disaster is — and what a marked departure this recession is from any we've seen in the modern era.
Dimitri B. Papadimitriou is president of the Levy Economics Institute of Bard College, and executive vice president and Jerome Levy Professor of Economics at Bard.
Photo by mangpages: Recession 1


www.hopeark.com Coenzyme Q10
Seriously, if you want rid of hair this will work, and I am confident it keeps it from coming back, and after a while of use you do get conditioned to using it, but right out of the box it really is painful to use. It does contain a lot of caffeine however. I've never had a problem with this ink. I've talked to several other people who have this kettle and have the same problem. Co Enzyme Q10 Heart Failure http://www.hopeark.com/
I wish I'd caught on to them a bit earlier. Ok, I've read some reviews that haven't been so kind to this pinpointer. Sales success is very much dependent upon buying success. Q10 Coenzyme Energizer Mask http://www.hopeark.com/127/coenzyme-q10-200-mg-solgar/
Don't Worry, Be Happy
In 1965, LBJ and the Demonicrats passed the Great Society legislation that included a cost of $6.6 trillion over a thirty year period, 1965-1995, just for the War on Poverty. That is an average of $220 billion per year during the administrations of Johnson, Nixon, Ford, Carter, Reagan, Bush I, and the first four years of Clinton. (At that time, $220 billion dollars was a lot of money.) We have absolutely nothing to show for this $6.6 trillion "investmernt" except for broken Black families, growth stagnated for seventeen years when the DOW flat-lined from 1965 to 1982 including the three recessions shown on the chart (73, 80, 81-82), and a national debt that totaled $6 trillion in 1995.
Reagan's 81-82 recession was moderately deep (blue line), but purged the economic system of inflation, unemployment, and excessive interest rates, just as a laxative purges the bowel of organic corruption. The Reagan Recovery triggered the greatest economic expansion in history, even as the War on Poverty dragged like an anchor behind the Ship of State.
Now we have a neo-Marxist (same as old Marxist) president who has instituted Marxist programs and is getting Marxist results. During the dismal decades of the Soviet Union, the economic cycle was not boom and bust, but recession in good times and depression in bad times. That is where we are going under Obama.
Enjoy.
The 1980 Recession -- WUWT
Martyman, this explanation is from memory (plus I am not a expert).
Economic contractions are determined by the rate of growth (or shrinkage) in the economy. The Graph refers to employment (percent of the population engaged in work) out to 43 months after the start of the recession -- not to the length of the "recession." Employment is a lagging indicator (The rate drops after the contraction starts and picks up after the next expansion begins).
The 1980 recession was short, growth returned but so did inflation. Perhaps Paul Volker (the Fed Chairman at the time) was voting for Carter and waiting until after the Presidential election to go after inflation. When Carter lost the Fed raised interest rates drastically to curb inflation (which was hitting double digits). That brought on the 1981 recession (which was aimed at curbing inflation and largely succeeded but at a high cost to Farmers and others).
On that chart the 1981 recession would start around month fifteen of the 1980 recession line. The "1980" line goes a little lower than the "1981" line because it started at a higher level of "percent of population working." However, the unemployment rate was higher in the 1981 recession (it came close to 11 percent), which is not apparent in the graph because that rate was higher at the start of that recession since it had not recovered fully from the 1980 recession. In July of 1981 it would be about 7.5 percent, if I remember correctly. According to that chart it took a bit over 30 months to get back to that level. The 1981-82 recession lasted about 16 months.
I should mention that this explanation is not necessarily correct -- or, for that matter, clear.
See What I Did There?
Now one comment post has become three, as I need to write this additional post to explain that my lack of commenting experience on blogs has lead to me failing to post my actual post and my complaint post in reverse order so that they read correctly. I hope you're satisfied.
See this
I am sure to all the commenters here! It's always nice when you can not only be informed, but also entertained! I'm sure you had fun writing this article. Thank you for the great article I did enjoyed reading it,Good article, nice site appearance, and friendly visitors. - Hotel Semarang
What's Up With That?
The green line is 43 months long, and yet the legend indicates the recession only lasted 6 months. Have the green and cyan lines been confused with each other? Even then the cyan line is much longer than 6 months. WUWT?
Thanks for sharing!)
Thanks for sharing!) Regards, http://www.top-fiancee.com/fr/ - Rencontre femmes russes