
The latest Statistics Canada data indicates that people are leaving Toronto and Montréal in large numbers since the 2011 census. Even so, both metropolitan areas continued to grow through the 2016 census as a result of net international migration and the natural increase of births over deaths (Figure 1). It turns out that Canada’s urban pattern is much more like that of the US, as well as other high-income countries, than many may suppose.
Toronto
Toronto lost 128,000 net domestic migrants, while Montréal lost 89,000 representing 2.3 percent of its total 2011 population.
At the same time, the migration has been regional rather than national. In the case of Toronto, more than 90 percent of the net migration loss was to other areas of Ontario (118,000), as opposed to other provinces (10,000). The metropolitan area losses were concentrated in the city of Toronto, which lost a net 119,000 domestic migrants, while the suburbs lost 9,000. The city’s loss of 4.5 percent was nearly double that of the metropolitan area and 15 times that of the suburbs.
Despite the late 1990s municipal amalgamation that increased the population of the city by three times, Toronto has become a majority suburban metropolitan area. The city of Toronto now has fallen to 46 percent of the population from 53 percent in 2001.
Part of the metropolitan area loss is likely the result of Toronto’s higher house prices and shortage of single family homes that people prefer (see: Ryerson University Research Cites Urban Containment Policy as Major Factor in Toronto House Price Escalation), with nearby metropolitan areas experiencing strong net domestic migration gains. Up to one-half of Toronto’s loss may have been picked up by Oshawa (16,000), Hamilton (12,000), St. Catharine’s-Niagara (8,000), Barrie (7,000), Guelph (4,000), Brantford (4,000) Kitchener-Cambridge-Waterloo (1,000) and Peterborough (1,000), which are served by the commuter rail or bus services of Go Transit (Metrolinx).
Moreover, with its highly dispersed employment patterns, commuters from exurban metropolitan areas can find employment much closer to home than downtown Toronto, with its less than 15 percent of metropolitan employment. A few years ago, it was reported that the largest employment center in Canada was the sprawling area around Pearson International Airport (Toronto-Missassauga-Brampton), rather than downtown Toronto. Meanwhile, the Kitchener-Cambridge-Waterloo area has emerged as Canada’s answer to Silicon Valley.
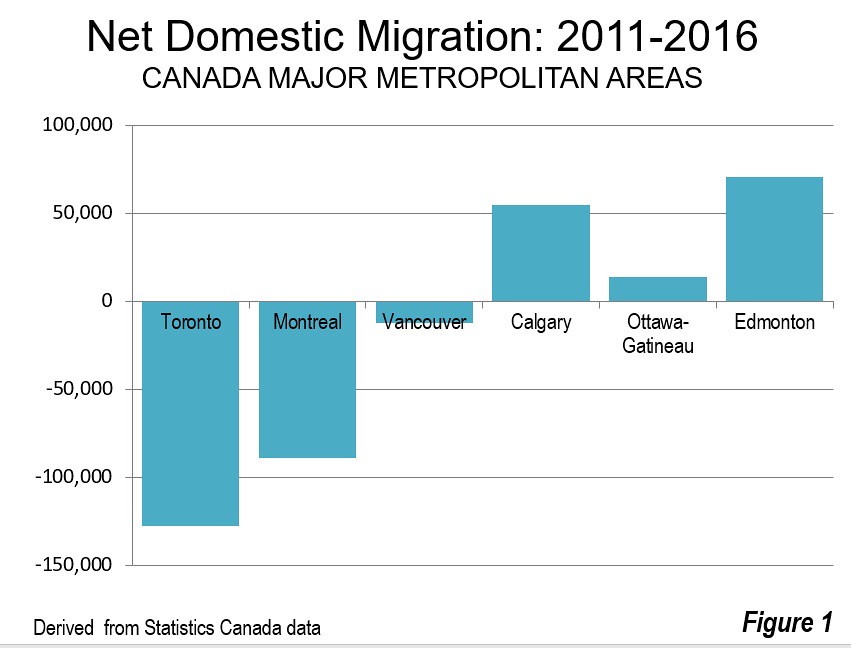
Montréal
Things were similar in Montréal, which lost 89,000 net domestic migrants, also representing 2.3 percent of its 2011 population. Unlike Toronto, Montréal’s loss was evenly split, with 45,000 moving out of Quebec and 44,000 moving to other parts of Québec.
The concentration of net domestic migration losses were even more concentrated in the core than in Toronto. The ville de Montréal lost 117,000 net domestic migrants, while the suburbs gained 28,000. The ville’s loss of 7.0 percent was three times the rate of the total metropolitan area.
Vancouver
Vancouver, the third largest metropolitan area, also lost domestic migrants (12,000) at a rate of 0.5 percent relative to its 2011 population. Vancouver gained 10,000 net domestic migrants from other provinces, while losing 22,000 to other parts of British Columbia. Kelowna and Victoria appear to have prospered at Vancouver’s expense, both adding a 7,000 net intraprovincial migrants.
Alberta: Calgary and Edmonton
As has been the case for years, Alberta’s two largest metropolitan areas have led the national statistics. Calgary, the fourth largest metropolitan area added 55,000 net domestic migrants between 2011 and 2016. Much of this 4.6 percent gain was from other provinces (41,000). With the recent oil bust, which has hit Alberta hard, net interprovincial migration dropped from 7,000 in 2014-2015 to minus 1,000 in 2015-2016.
Edmonton, Alberta’s second largest metropolitan area and Canada’s sixth largest, added even more net domestic migrants (72,000), for the strongest performance in the country. This 6.2 percent gain was also concentrated in people from outside the province (48,000). As in Calgary, net interprovincial migration fell strongly from 2014-2015 to 2015-2016, from 10,000 to 2,000.
It remains to be seen how the recovering energy industry will impact the economy and migration trends in Alberta.
Ottawa-Gatineau
Ottawa-Gatineau (Ontario- Québec) has Canada’s capital and is the only major metropolitan area that spans two provinces. Ottawa-Gatineau is Canada’s fifth largest metropolitan area although likely to be overtaken almost at any time by faster growing Edmonton. Ottawa-Gatineau gained 14,000 net domestic migrants between 2011 and 2016 (1.1 percent). Most of the net domestic migration was from other parts of Ontario or Québec (10,000).
Smaller Census Metropolitan Areas
Among the other 27 census metropolitan areas that had been designated by the 2011 census, the largest percentage gain was in Kelowna, BC, at 8.4 percent. Saint John, New Brunswick had the largest net domestic migration loss at minus 3.5 percent.
Overall Results
Approximately two thirds of Canada’s population resides in the census metropolitan areas. Between 2011 and 2016, there was a net domestic migration of only 17,000 from outside the metropolitan areas (Table). Among the six major metropolitan areas, there was a net domestic migration loss of 89,000, probably driven in large measure by the “severely” or “seriously” unaffordability of housing virtually everywhere but Ottawa-Gatineau. While new metropolitan areas are likely to be designated (like Lethbridge, Alberta since 2011), it may be that there will be little additional net domestic migration to the largest metropolitan areas, and what will occur is largely in the suburbs.
| Net Domestic Migration: Canada Metropoltian Areas: 2011-2016 | |||
| Census Metropolitan Area | 2016 Census Population | Net Domestic Migration | % of 2011 Population |
| Toronto, Ontario | 5,928,040 | (128,432) | -2.3% |
| Montréal, Quebec | 4,098,927 | (88,913) | -2.3% |
| Vancouver, British Columbia | 2,463,431 | (11,928) | -0.5% |
| Calgary, Alberta | 1,392,609 | 55,415 | 4.6% |
| Ottawa-Gatineau, Ontario/Quebec | 1,323,783 | 14,119 | 1.1% |
| Edmonton, Alberta | 1,321,426 | 71,620 | 6.2% |
| Québec, Quebec | 800,296 | 2,683 | 0.3% |
| Winnipeg, Manitoba | 778,489 | (17,812) | -2.4% |
| Hamilton, Ontario | 747,545 | 12,208 | 1.7% |
| Kitchener-Cambridge-Waterloo, Ontario | 523,894 | 1,390 | 0.3% |
| London, Ontario | 494,069 | 4,534 | 1.0% |
| St. Catharines-Niagara, Ontario | 406,074 | 8,030 | 2.0% |
| Halifax, Nova Scotia | 403,390 | 2,926 | 0.7% |
| Oshawa, Ontario | 379,848 | 16,028 | 4.5% |
| Victoria, British Columbia | 367,770 | 17,647 | 5.1% |
| Windsor, Ontario | 329,144 | (48) | 0.0% |
| Saskatoon, Saskatchewan | 295,095 | 8,672 | 3.3% |
| Regina, Saskatchewan | 236,481 | 2,004 | 0.9% |
| Sherbrooke, Quebec | 212,105 | 1,792 | 0.9% |
| St. John's, Newfoundland and Labrador | 205,955 | 7,949 | 4.0% |
| Barrie, Ontario | 197,059 | 6,943 | 3.7% |
| Kelowna, British Columbia | 194,882 | 15,171 | 8.4% |
| Abbotsford-Mission, British Columbia | 180,518 | 2,952 | 1.7% |
| Greater Sudbury, Ontario | 164,689 | (1,285) | -0.8% |
| Kingston, Ontario | 161,175 | 5,572 | 3.5% |
| Saguenay, Quebec | 160,980 | (782) | -0.5% |
| Trois-Rivières, Quebec | 156,042 | 2,721 | 1.8% |
| Guelph, Ontario | 151,984 | 3,384 | 2.4% |
| Moncton, New Brunswick | 144,810 | 2,425 | 1.7% |
| Brantford, Ontario | 134,203 | 3,603 | 2.7% |
| Saint John, New Brunswick | 126,202 | (4,512) | -3.5% |
| Peterborough, Ontario | 121,721 | 1,394 | 1.2% |
| Thunder Bay, Ontario | 121,621 | (330) | -0.3% |
| Total | 24,724,257 | 17,140 | 0.1% |
| Derived from Statistics Canada data | |||
Wendell Cox is principal of Demographia, an international public policy and demographics firm. He is a Senior Fellow of the Center for Opportunity Urbanism (US), Senior Fellow for Housing Affordability and Municipal Policy for the Frontier Centre for Public Policy (Canada), and a member of the Board of Advisors of the Center for Demographics and Policy at Chapman University (California). He is co-author of the "Demographia International Housing Affordability Survey" and author of "Demographia World Urban Areas" and "War on the Dream: How Anti-Sprawl Policy Threatens the Quality of Life." He was appointed to three terms on the Los Angeles County Transportation Commission, where he served with the leading city and county leadership as the only non-elected member. He served as a visiting professor at the Conservatoire National des Arts et Metiers, a national university in Paris.
Photo: Photo: Old City Hall, Toronto (by author)


