Image:
Notes:
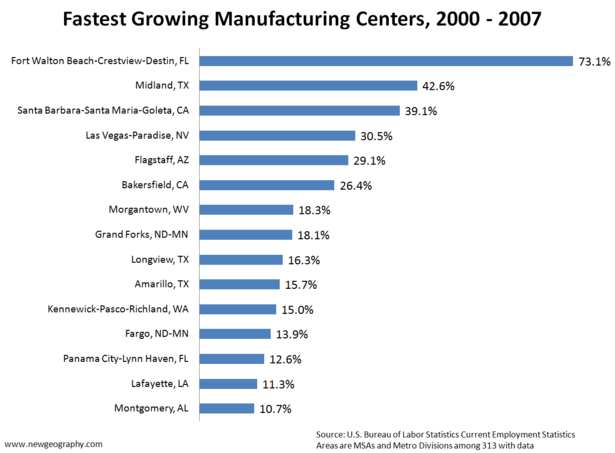
Areas are MSAs, highest growth rates among 313 metro areas with data
Source:
U.S. Bureau of Labor Statistics Current Employment Statistics
Manufacturing Growth Centers, by percent growth, 2000-2007
by Mark Schill 07/14/2008
Image: Notes: Areas are MSAs, highest growth rates among 313 metro areas with data Source: U.S. Bureau of Labor Statistics Current Employment Statistics »
|
Subscribe to NG ArticlesFeatured Content
The Coming of Neo-Feudalism
Infinite Suburbia
Books
Authored by Aaron Renn, The Urban State of Mind: Meditations on the City is the first Urbanophile e-book, featuring provocative essays on the key issues facing our cities, including innovation, talent attraction and brain drain, global soft power, sustainability, economic development, and localism. Popular ContentMore from this authorRecommended Books
Blogroll and Partner SitesUser login |


