
There continues to be a perception among many that America’s suburbs and exurbs are overwhelmingly White-Non-Hispanic, with little minority population. Nothing could be further from the truth, is indicated by an analysis of major metropolitan area growth, using the City Sector Model (See: Note).
White-Non-Hispanic Suburban Growth Dwarfed by Hispanic, Black, Asian Suburban Growth
Nearly 97% of suburban and exurban population growth was not White-Non-Hispanics from 2000 to 2015/2019 (middle year 2017), which is the latest data available (Figure 1 and Figure 2).
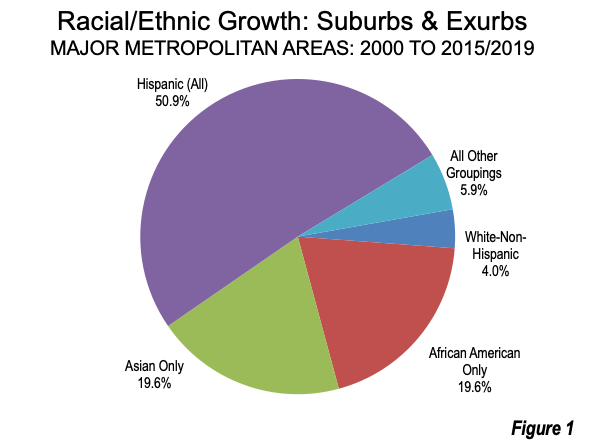
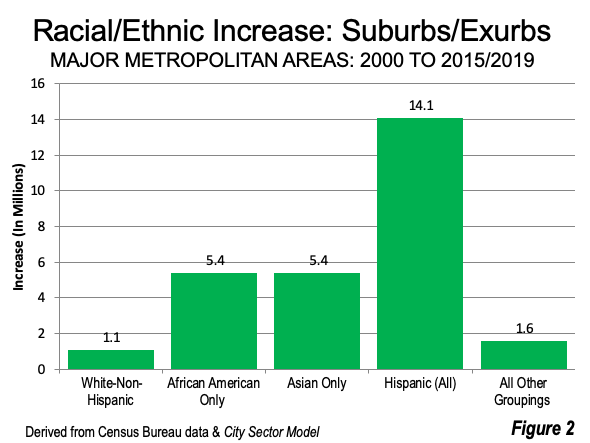
- Hispanics made up a majority of the suburban and exurban population growth (50.9%), adding 14.1 million.
- Asians accounted for 19.6% of suburban and exurban growth, an increase of 5.4 million.
- African-Americans made up 19.6% of suburban and exurban growth, an increase of 5.4 million.
- All other groupings (other races and multiple races) were 5.9% of suburban and exurban growth, an increase of 1.6 million.
- The balance of the growth, 4.0% was White-Non-Hispanics, with the smallest increase, at 1.1 million.
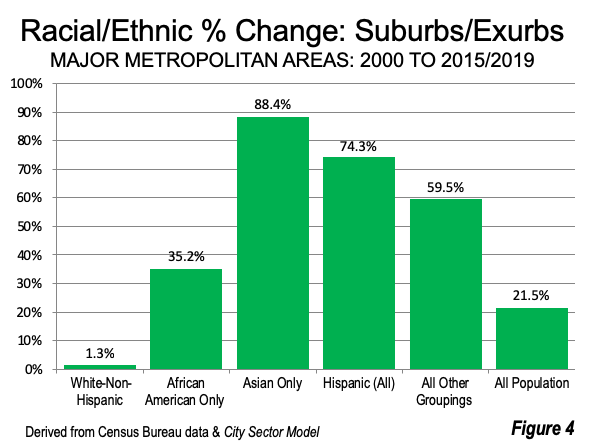
In recent decades, minority suburban populations have increased substantially. Since 2000, Asians had the largest suburban and exurban population gain, at 88%. Hispanics gained 74%, while African Americans gained 35%. The White-Non-Hispanic suburban and exurban population rose by far the least, at one percent (Figure 3).
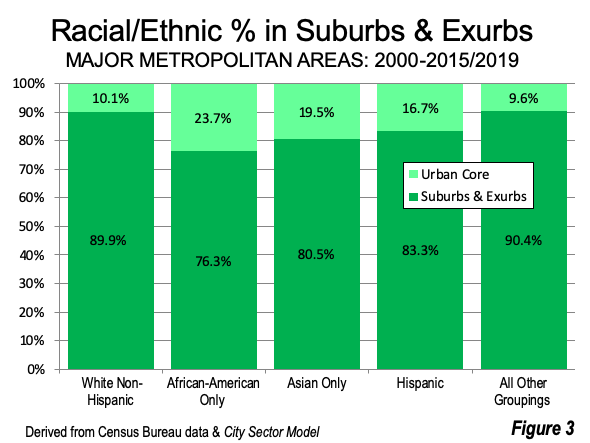
Today, a majority of each larger minority have lives in the suburbs and exurbs, ranging from African-Americans (76.3%), to Asians (80.5%) to Hispanics (83.3%). Nearly 90% of White-Non-Hispanics live in the suburbs and exurbs (Figure 4). This is nothing new. By 2000, more than two-thirds of African-Americans lived in the suburbs and exurbs and more than three quarters of Asians and Hispanics. The suburban exodus, often called “white flight” has long since evolved into “Black flight,” “Asian flight” and “Hispanic flight.”
Urban Core Growth
Growth patterns in the Urban Cores, have been considerably different. The urban cores contain all population that is not in the suburbs or the exurbs.
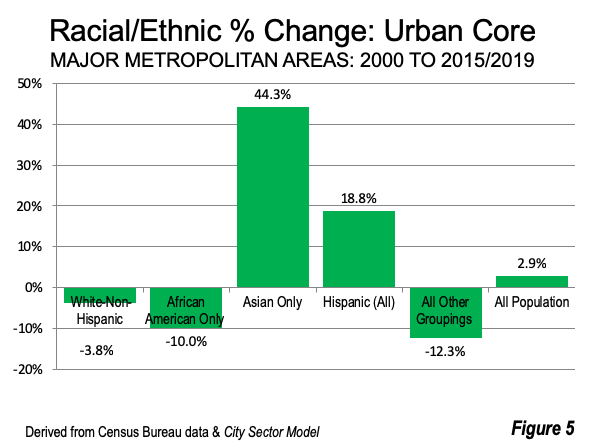
As in the suburbs and exurbs, Asians had the strongest population gain in the Urban Core, which includes the CBDs and the Inner Ring, with 44% gain. Hispanics gained 19%, while the African-American population dropped 10% (Figure 5). White-Non-Hispanic numbers dropped 4%.
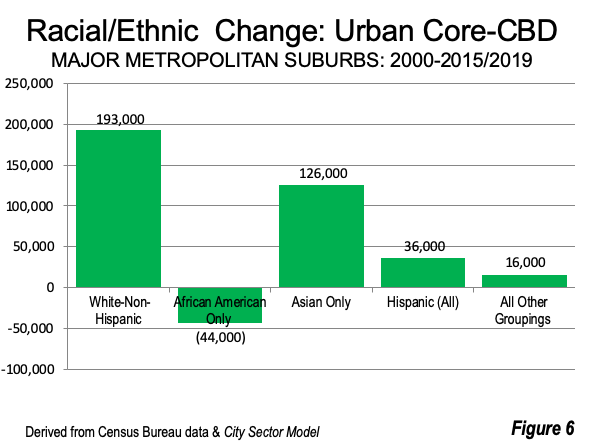
Paradoxically, in the one sector of the metropolitan area that has experienced the greatest residential rejuvenation, the Urban Core-CBD (Central Business District), White-Non-Hispanics have had the majority of population growth (59%). Thus, White-Non-Hispanics, often perceived as heading to the suburbs, have accounted for most the growth in of CBD, which comprises only 1.4% of major metropolitan population. Asians accounted for 39% of the growth in the CBD. Thus, 98% of Urban Core-CBD growth has been among White-Non-Hispanics and Asians (Figure 6), both of which have higher median incomes than the nation. At the same time, there was a substantial loss in African-American population, which may be at least partially driven by gentrification.
Minorities and White-Non-Hispanic Suburban Compositions Similar to Overall
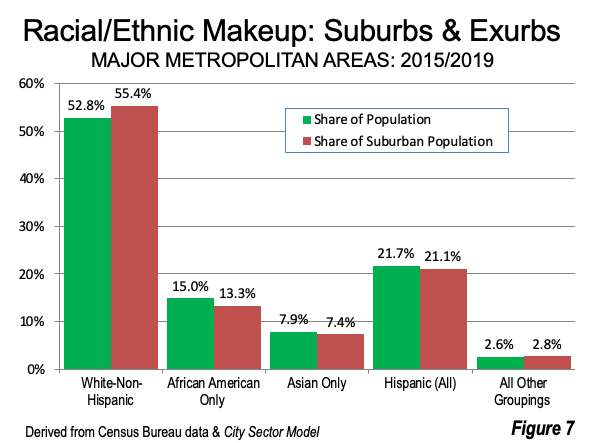
Indeed, the suburbs and exurbs now have distributions of race and ethnicity that are similar to the overall distribution of the population (Figure 7). Perhaps most surprisingly, the share of White-Non-Hispanics in the suburbs and exurbs is only 2.6 percentage points above their overall major metropolitan area share.
Shared Values, Shared Suburbs and Exurbs
The broadness of the values that drove virtually all races and ethnicities to the suburbs and exurbs is evident in housing commuting and housing statistics (Figure 8).
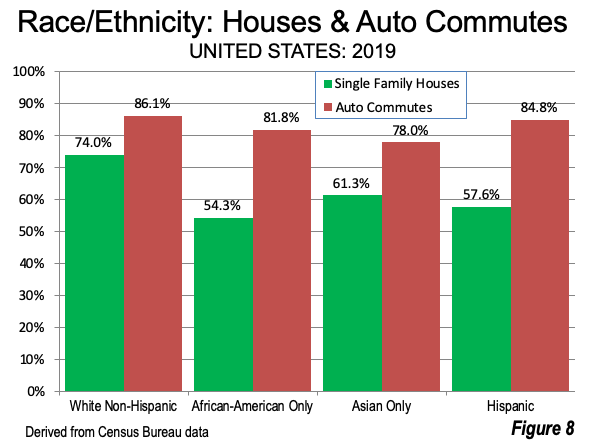
One of the two most important characteristics of suburbanization is auto use. There is good reason for this. Residents can reach 55 times as many jobs in one-half hour as by transit in the 50 largest metropolitan areas. Moreover, the auto provides a means for avoiding the all too frequent “food deserts” that force the autoless to pay more for groceries, because they easily reach much of the very competitive retail market. The national difference between auto availability between the four races/ethnicities is only 8 percentage points (White-Non-Hispanics at 86% compared to Asians at 78%). In addition, 82% of African-Americans commute to work by car. Hispanics commute by car to work almost at the White-Non-Hispanic rate (86% versus 85%).
The story in housing is not nearly as favorable, with a much larger 20 percentage point difference in single-family houses, between White-Non-Hispanics (74%) and African-Americans (54%) and a 16 percentage point difference compared to Hispanics (58%). Moreover, the overwhelming majority — 83% — of single-family houses are owner occupied, well above the home ownership rate of 64%.
Car prices have risen far less than house costs in many metropolitan areas. This can be attributed, at least in part, to the more intense land use regulation that drives up housing costs in metropolitan areas like Seattle, Denver, Portland (Oregon), Denver, Miami, New York and Boston, as well as across California. This disadvantages households that want to own their own homes, including those with lower incomes, which are disproportionally concentrated among African-Americans and Hispanics.
Despite the higher housing prices, the preference for both short commutes with maximum employment access and houses is clear. The suburbs and exurbs have made the American dream increasingly diverse.
Note: Demographia City Sector Model (back to top)
The Demographia City Sector Model analysis is now in its eighth year. Improved data from the American Community Survey made it possible to better separate urban core, suburban and exurban life styles and functions within metropolitan areas. Before, nearly all urban core, suburban and exurban analysis within metropolitan areas was based on municipal or county jurisdictions. The problem was, however, that nearly all new development since World War II had been lower density, principally single-family houses, while the automobile quickly replaced much of the commuting that had been previously been on transit or on foot.For the most part, the only core municipalities that annexed substantially have grown since World War II, and that growth has been suburban in character.
The Demographia City Sector Model classifies zip code (postal code) residents based principally on population densities and extent of automobile commuting into five functional classifications, which are indicated in Figure 9. The intent is to separate the pre-World War II portion of metropolitan areas from the suburban development that has dominated since that time.
Wendell Cox is principal of Demographia, an international public policy firm located in the St. Louis metropolitan area. He is a founding senior fellow at the Urban Reform Institute, Houston, a Senior Fellow with the Frontier Centre for Public Policy in Winnipeg and a member of the Advisory Board of the Center for Demographics and Policy at Chapman University in Orange, California. He has served as a visiting professor at the Conservatoire National des Arts et Metiers in Paris. His principal interests are economics, poverty alleviation, demographics, urban policy and transport. He is co-author of the annual Demographia International Housing Affordability Survey and author of Demographia World Urban Areas.
Mayor Tom Bradley appointed him to three terms on the Los Angeles County Transportation Commission (1977-1985) and Speaker of the House Newt Gingrich appointed him to the Amtrak Reform Council, to complete the unexpired term of New Jersey Governor Christine Todd Whitman (1999-2002). He is author of War on the Dream: How Anti-Sprawl Policy Threatens the Quality of Life and Toward More Prosperous Cities: A Framing Essay on Urban Areas, Transport, Planning and the Dimensions of Sustainability.
Photo: Suburban Chicago, by author


Far more complex
Thanks for this statistical picture of an urban-suburban, white-nonwhite America that is so different from the portrait that our politics paint. My favorite reference point for seeing this America in the flesh is to visit nearly any Costco (or Sam's Club, if you like).