As George Bernard Shaw is reported to have said, Britain and America are two countries separated by a common language. So too, America and Australia, not to mention America and Canada, New Zealand, and elsewhere.
That was brought home to me with respect to my recent article (The Urban Containment Effect (Zoning Effect) on Australian House Prices) which detailed the extent to which land use strategies that destroy the competitive market for land on urban fringes also destroys housing affordability. This is a malady evident virtually everywhere in Australia.
For Australian readers, a better title would have been “The Urban Consolidation Effect (Zoning Effect) on Australian House Prices,” since “urban consolidation” is the most used term for urban containment in Australia. “Urban containment” is the more widely used international term.
Figures 2 and 3, from the original article, are reproduced below, substituting “urban consolidation” for “urban containment.” The core findings are revised to substitute “urban consolidation” for “urban containment” below:
The Urban Containment Effect in Major Australian Cities (2016)
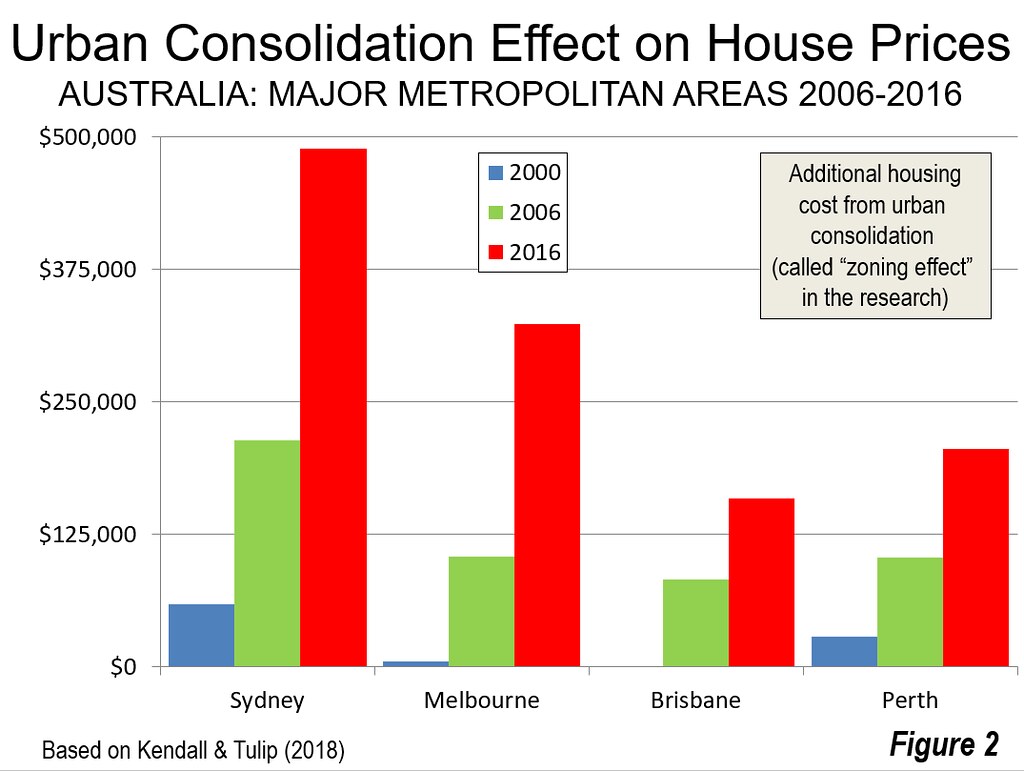
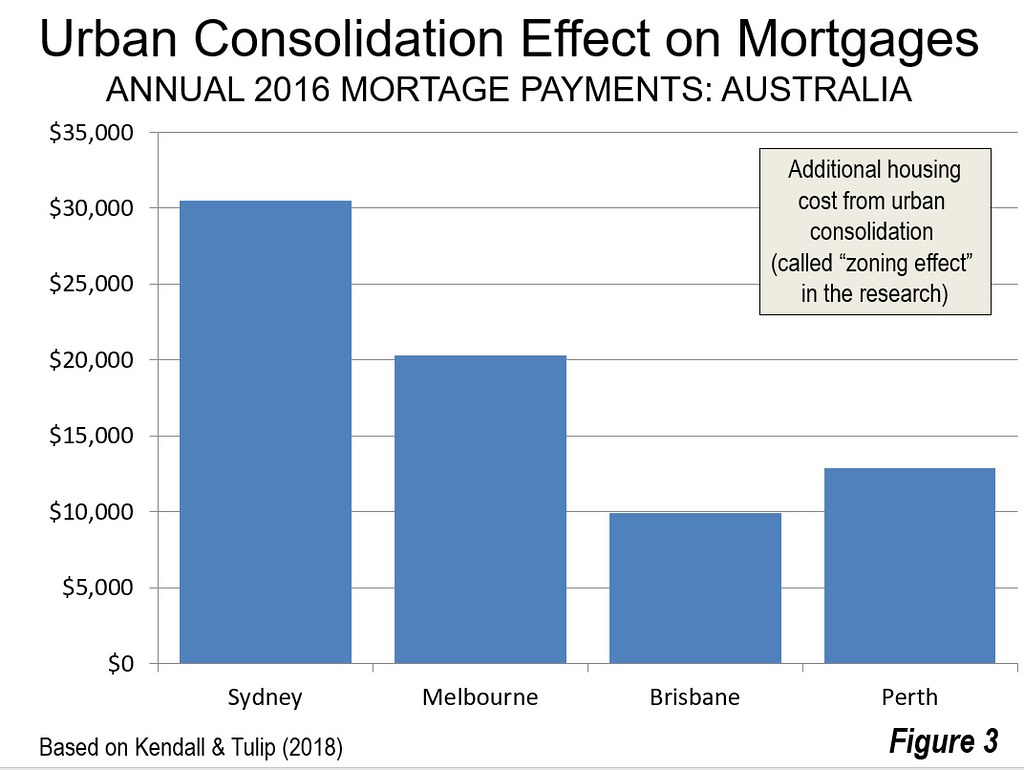
Houses are more costly as a result of urban consolidation. Assuming typical mortgage provisions, (Note) the urban containment effect adds from $150,000 to nearly $500,000 to house prices in major Australian metropolitan areas --- this is not the house price, but the additional impact of urban containment (Figure 2). The urban containment effect adds up to $29,000 to annual payments on the average house in Australia’s major metropolitan areas (Figure 3).
• In Sydney, the urban consolidation effect adds $489,000 to the house price making the annual mortgage payments $29,000 higher. Figure 4 shows the components of the average house price in Sydney.
• In Melbourne, the urban consolidation effect adds $324,000 to the house price, making the annual mortgage payments $19,000 higher.
• In Brisbane, the urban consolidation effect adds $159,000 to the house price, making the annual mortgage payments $9,000 higher.
• In Perth, the urban consolidation effect adds $206,000 to the house price, making the annual mortgage payments $12,000 higher.
• No data is available for Adelaide, but the present median multiple (median house price divided by median household income) suggests that the urban consolidation effect adds at least $13,000 to the mortgage.
These are significant amounts, especially to families starting out and renters who would like to participate in the proverbial “Great Australian Dream” of home ownership.