
Los Angeles officials hope to convince Congress take the unprecedented step of having the US Treasury to front money for building the area’s planned 30 year transit expansions in 10 years instead. The money would be paid back from a one-half cent sales tax (Measure R), passed by the voters in 2008. That referendum required 35% of the new tax money to be spent on building 12 rail and exclusive busway transit lines.
Measure R was not the first instance of Los Angeles officials committing to spend 35% of a new one-half cent sales tax on new transit lines.
Proposition a: the Start of it All
In 1980, County Supervisor and Los Angeles County Transportation Commission (LACTC) chairman Kenneth Hahn, whose district included low-income south Los Angeles, made a last-minute proposal (Note 1) to place a half-cent sales tax on the ballot to lower bus fares to $0.50. No funding would have been provided for rail.
Chairman Hahn’s proposal was amended twice and adopted by LACTC (Note 2). The first amendment provided funding to municipalities to start or expand their own transit services. The second amendment (which I spontaneously introduced), dedicated 35% of the money to building a rail system (My seconder, Supervisor Baxter Ward, required excluding busways). A 10 corridor map was drawn during the meeting (see Rail Rapid Transit System above). LACTC (Note 2) approved the program, which was adopted by the voters as Proposition A in November of 1980.
Results: The Proposition A programs met with varying levels of success (and failure):
Bus Fare Reduction: The bus fare was reduced for three years. As a result, transit ridership at the Southern California Rapid Transit District (SCRTD), the principal bus operator, rose 40%, to its modern peak, in perhaps the largest major system ridership increase in modern history. The program was also cost effective, with a cost per new passenger of $0.56 (2008$), a small fraction of virtually any new rail system built in the United States in recent decades. Fares were raised in 1985 and one-third of the bus ridership disappeared.
Municipal Transit Services: The more efficient municipal bus operators (such as Santa Monica, Long Beach, Gardena, Montebello and others) used the new money to expand their services and ridership. Other jurisdictions established new local services, usually provided more cost-effectively by private operators under competitive contracts (costs average 40% less per hour).
Rail Program: As it turned out, LACTC grossly over-promised on the its rail system. By 1990, only four lines were either completed or under construction but there was no money for the rest. Another half cent tax was approved by the voters to finish the job. By 2008, six lines were completed or under construction, still short of the 1980 promise. During the interim, two new exclusive busways had also been added to the system. The 2008 referendum, Measure R, would finish the job, and more, by building 12 new rail or exclusive bus lines.
Nonetheless, approximately 300,000 people ride the metro and light rail trains of the Los Angeles County Metropolitan Transit Authority (formerly the Southern California Rapid Transit District) every day. Some MTA officials have even suggested that this decade’s modest growth in Los Angeles traffic congestion has resulted from people giving up their cars to ride the rail lines.
The Results: The reality is quite different. Even when gasoline prices peaked at nearly $5.00 per gallon in 2008, total MTA bus and rail ridership was 5% below 1985 levels, indicating that for each new rail rider; at least one former bus rider had abandoned transit. Daily bus ridership dropped more than 300,000 (Table 1).
Moreover, traffic congestion growth slowed during this decade Los Angeles not due to a shift to transit (there wasn’t one), but because of its anemic population growth, with Los Angeles County adding only one-quarter the number of new residents during the 2000s as had been forecast. The Los Angeles metropolitan area (including Orange County) also had the highest rate of domestic outmigration in the nation from 2000 to 2009, losing at a rate one-third greater than Detroit. Employment in Los Angeles County was at the same level in 2008 as in 2000.
| Table 1 | |||
| MTA/SCRTD Ridership, Costs and Fare Recovery: 1985-2008 | |||
| 1985 | 2008 | Change | |
| Unlinked Trips (Millions) | 497 | 474 | -5% |
| Passenger Miles (Millions) | 1,947 | 1,989 | 2% |
| Operating & Annualized Capital Costs (Millions) | $ 1,077 | $ 1,775 | 65% |
| Cost per Passenger Mile | $ 0.55 | $ 0.89 | 61% |
| Bus: Cost per Passenger Mile | $ 0.55 | $ 0.77 | 38% |
| Light Rail: Cost per Passenger Mile | $ 0.85 | ||
| Metro: Cost per Passenger Mile | $ 1.81 | ||
| Fare Ratio | 23% | 19% | -19% |
| Bus: Fare Ratio | 23% | 25% | 5% |
| Light Rail: Fare Ratio | 11% | ||
| Metro: Fare Ratio | 8% | ||
| Bus capital costs estimated using national ratio from APTA Transit Fact Book | |||
| Rail capital costs estimated from mid-year of project construction (discounted at 7% over 30 years) | |||
The Costs: Rail systems are often promoted for their “cost-effectiveness.” However, these claims always exclude the cost of capital (building the system and buying the vehicles). Capital costs are far higher for rail systems than for buses. Los Angeles is no exception. It is estimated that SCRTD/MTA annual capital and operating costs rose 65% from 1985 to 2008, adjusted for inflation, in large measure due to the rail services. Bus riders pay double or triple the fares in relation to costs as rail riders (Table 1).
With Other Bus Operators: Ridership Up, Market Share Down:
Los Angeles is somewhat unique as a metropolitan area in having a large number of transit operators. So, even as the MTA/SCRTD system grew, the other bus systems expanded more rapidly. This was made possible by their more cost-effective operation and, especially among the newer systems, the use of competitive contracting (contracts with private operators) to reduce costs even more. In 2008, for example, more than 35% of the county's bus service was provided by operators other than MTA. Approximately 85% of the added transit usage (passenger miles) from 1985 to 2008 was from the bus services of these other operators.
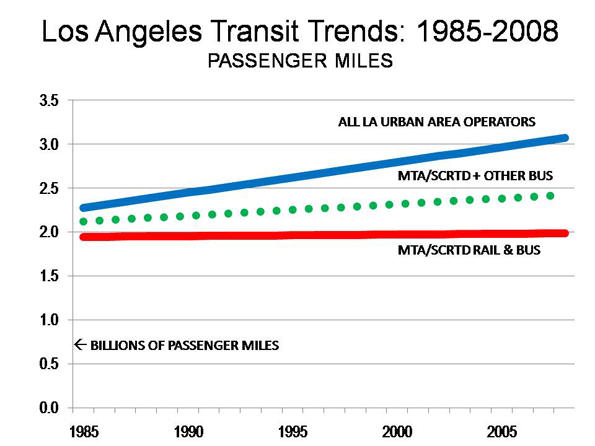
Overall transit ridership increased in the Los Angeles urban area, with the new five-county Metrolink commuter rail system contributing substantially to the increase as well. The neighboring Orange County Bus system doubled its ridership, while rejecting rail (Figure). Even so, transit's market share in the Los Angeles urban area declined nearly 10% from 1985 to 2008 (Table 2).
| Table 2 | |||
| LOS ANGELES URBAN AREA ROADWAY & TRANSIT DATA | |||
| 1985 | 2008 | Change | |
| Annual Roadway Passenger Miles | 114,590 | 168,219 | 47% |
| Annual Transit Passenger Miles | 2,279 | 3,071 | 35% |
| Roadway & Transt Passenger Miles | 116,869 | 171,290 | 47% |
| Transit Market Share | 2.0% | 1.8% | -8% |
| Freeway Lane Miles | 5,310 | 6,992 | 32% |
| Vehicle Miles per Freeway Lane Mile | 13,487 | 15,037 | 11% |
| Average Congestion Delay (Peak Period) | 27% | 49% | 81% |
| Los Angeles urban area includes Mission Viejo urban area. | |||
| Metrolink commuter rail system: 75% of passenger miles estimated in Los Angeles urban area. Annual passenger miles in millions |
|||
Prospects: The Next 30 Years
Los Angeles has again committed to a major expansion of transit service, despite the fact that the Metro and light rail lines have done little more than siphon ridership from buses. There is little to suggest that the future will be any more successful than the past.
- MTA, like LACTC before it appears to have over-promised on transit expansion. 35% of a half-cent sales tax is no more likely to finance a 12 line expansion today than a 35% share could fund an 11 line expansion in the 1980s and 1990s.
- Nonetheless, new transit lines will be built. These Measure R expansions are likely, however, to be no more successful in reducing traffic congestion than the earlier rail expansions.
Further, funding the Measure R rail system is likely to be more challenging. The original Proposition A was followed by decades of growth, which generated rising tax revenues. Now, however, both LA’s population and employment growth have ground to a standstill. The rosy revenue forecasts are not likely to be achieved, which should be a matter for concern among not only local officials, but to the federal taxpayers being asked for a hefty advance.
Notes
1. LACTC had held hearings on a proposed ballot initiative, but a consensus had developed that no referendum would be placed on the ballot in 1980. Chairman Hahn surprisingly called a special meeting of LACTC just before the deadline for submitting a measure to the ballot.
2. LACTC was the principal transportation (transit and highways) policy body in Los Angeles County from 1977 to 1993. By state law, the commission included the mayor of Los Angeles, the five county supervisors (county commissioners), the major of Long Beach, two elected officials from smaller cities, and two additional appointments by the mayor of Los Angeles. Mayor Tom Bradley routinely appointed a city council member to LACTC and a private citizen (three times the author of this article). In 1992, LACTC and SCRTD merged into the Los Angeles County Metropolitan Transportation Authority (MTA), which has a similarly composed board of directors.
Illustration: 1980 Proposition A Rail Map (Los Angeles County Transportation Commission)
Wendell Cox is a Visiting Professor, Conservatoire National des Arts et Metiers, Paris. He was born in Los Angeles and was appointed to three terms on the Los Angeles County Transportation Commission by Mayor Tom Bradley. He is the author of "War on the Dream: How Anti-Sprawl Policy Threatens the Quality of Life.”


Hey what a brilliant post I
Hey what a brilliant post I have come across and believe me I have been searching out for this similar kind of post for past a week and hardly came across this. Thank you very much and will look for more postings from you.
מבזקי חדשות
This is a great inspiring
This is a great inspiring article.I am pretty much pleased with your good work.You put really very helpful information...
www textyourexbackforum
I found that site very
I found that site very usefull and this survey is very cirious, I ' ve never seen a blog that demand a survey for this actions, very curious...
how to attract financial success
Its a great pleasure reading
Its a great pleasure reading your post.Its full of information I am looking for and I love to post a comment that "The content of your post is awesome" Great work.
https://rebelmouse.com/michaelfioresecretsurveyreview/
Great Article it its really
Great Article it its really informative and innovative keep us posted with new updates. its was really valuable. thanks a lot.
can you get rid of diabetes with diet and exercise
I found your this post while
I found your this post while searching for some related information on blog search...Its a good post..keep posting and update the information.
http://www.rebelmouse.com/
I just found this blog and
I just found this blog and have high hopes for it to continue. Keep up the great work, its hard to find good ones. I have added to my favorites. Thank You.
Web Design & SEO Denton TX
Your website is really cool
Your website is really cool and this is a great inspiring article.
rebelmouse com
I can see that you are an
I can see that you are an expert at your field! I am launching a website soon, and your information will be very useful for me.. Thanks for all your help and wishing you all the success in your business.
diane neal measurements
I simply want to tell you
I simply want to tell you that I am new to weblog and definitely liked this blog site. Very likely I’m going to bookmark your blog . You absolutely have wonderful stories. Cheers for sharing with us your blog.
Ai wei wei