The Bureau of Economic Analysis yesterday released the 2009 data for metropolitan area GDP. Their headline, “Economic Decline Widespread in 2009,” should come as a surprise to no one.
The BEA focuses on the year on year change. I’d rather look at the full span of the data that’s available, which is now 2001-2009. Here’s a look at percent change in total real metro area GDP during that time period:
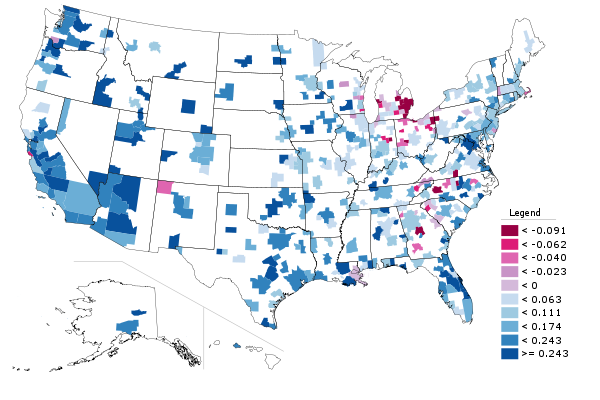
And here are the top ten metro areas over one million in population on this metric:
| Row | Metro | 2001 | 2009 | Pct Change |
| 1 | Portland-Vancouver-Hillsboro, OR-WA | 81,505 | 114,028 | 39.90% |
| 2 | Oklahoma City, OK | 43,835 | 59,532 | 35.81% |
| 3 | Austin-Round Rock-San Marcos, TX | 55,466 | 75,136 | 35.46% |
| 4 | Las Vegas-Paradise, NV | 63,730 | 82,255 | 29.07% |
| 5 | Orlando-Kissimmee-Sanford, FL | 71,940 | 91,400 | 27.05% |
| 6 | Phoenix-Mesa-Glendale, AZ | 138,780 | 174,617 | 25.82% |
| 7 | Washington-Arlington-Alexandria, DC-VA-MD-WV | 294,656 | 368,793 | 25.16% |
| 8 | San Jose-Sunnyvale-Santa Clara, CA | 117,447 | 146,448 | 24.69% |
| 9 | Salt Lake City, UT | 48,157 | 59,603 | 23.77% |
| 10 | San Diego-Carlsbad-San Marcos, CA | 126,875 | 155,850 | 22.84% |
Per capita tells is a little bit different story. Here’s a map of US metro areas for percent change in real GDP per capita:
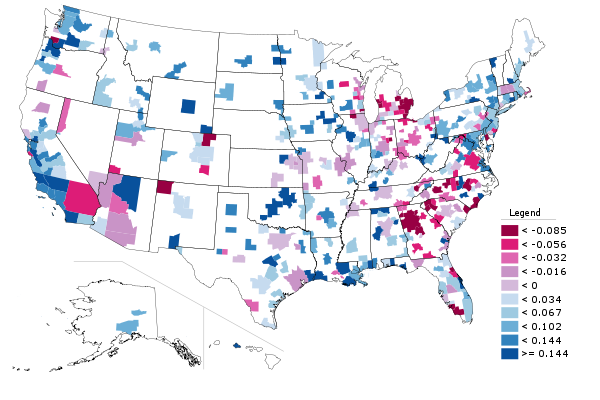
The stunning collapse in real per capita GDP and also the erosion in per capita personal income relative to the nation is one of the key reasons I see Atlanta as a region with far more troubles than is generally assumed.
Here are the top ten large metros again:
| Row | Metro | 2001 | 2009 | Pct Change |
| 1 | Portland-Vancouver-Hillsboro, OR-WA | 41,256 | 50,863 | 23.29% |
| 2 | Oklahoma City, OK | 39,573 | 48,507 | 22.58% |
| 3 | San Jose-Sunnyvale-Santa Clara, CA | 67,299 | 79,604 | 18.28% |
| 4 | San Diego-Carlsbad-San Marcos, CA | 44,252 | 51,035 | 15.33% |
| 5 | San Francisco-Oakland-Fremont, CA | 63,260 | 72,259 | 14.23% |
| 6 | Los Angeles-Long Beach-Santa Ana, CA | 46,147 | 52,158 | 13.03% |
| 7 | Washington-Arlington-Alexandria, DC-VA-MD-WV | 59,801 | 67,344 | 12.61% |
| 8 | Virginia Beach-Norfolk-Newport News, VA-NC | 37,960 | 42,521 | 12.02% |
| 9 | Buffalo-Niagara Falls, NY | 31,160 | 34,472 | 10.63% |
| 10 | New Orleans-Metairie-Kenner, LA | 49,100 | 53,835 | 9.64% |
All I can say is, this data looks great for Portland. That city isn’t perfect to be sure, but on the GDP side of the house, the plan is working beautifully. Contrary to slacker stereotypes, high value work is increasingly being produced there.
Aaron M. Renn is an independent writer on urban affairs based in the Midwest. His writings appear at The Urbanophile.


