Some of the best evidence that the tide has not turned against dispersion and suburbanization comes from an unlikely source: New York’s 2010 census results. If dense urbanism works anywhere in America, it does within this greatest of US traditional urban areas.
Before the actual count, the Census Bureau estimated, in large part as a result of a successful historical core municipality (city of New York) challenges, that as of Census Day (April 1, 2010), the city would have added 413,000 residents since 2000 and would have accounted for more than one-half of the metropolitan area growth. But the numbers turned out startlingly different. In fact, the city’s census count came in nearly 250,000 below projections and accounted for the lowest share of New York metropolitan area growth since the 1970s.
Overall the 2010 census figures paint a picture of continuing dispersion in the nation’s largest metropolitan area, New York. The metropolitan area stretches from Manhattan, with the world’s second largest business district (after Tokyo) to the four outer boroughs of the city of New York, more than 100 miles to the eastern end of Long Island, north to Putnam and Rockland counties, completely across northern New Jersey, jumping the Delaware River to include Pike County, Pennsylvania and south to Ocean County (New Jersey), nearly all the way to Atlantic City. In all, this 23 county metropolitan area has the nation’s largest population and actually extended its margin over second place Los Angeles, which has been converted from a growth leader to a laggard giant growing slower than most Midwestern metropolitan areas. New York added 574,000 residents, while Los Angeles added 473,000. If New York continues to add more people than Los Angeles in future censuses, its position as the nation’s largest metropolitan area be secure.
Major metropolitan areas in general did poorly in terms of growth in the new cesusus. This was particularly true in New York. Between 2000 and 2010, the New York metropolitan area population rose from 18,323,000 to 18,897,000, a modest growth rate of 3.1 percent, one of the slowest among major metropolitan areas in the country. The national growth rate was three times as high
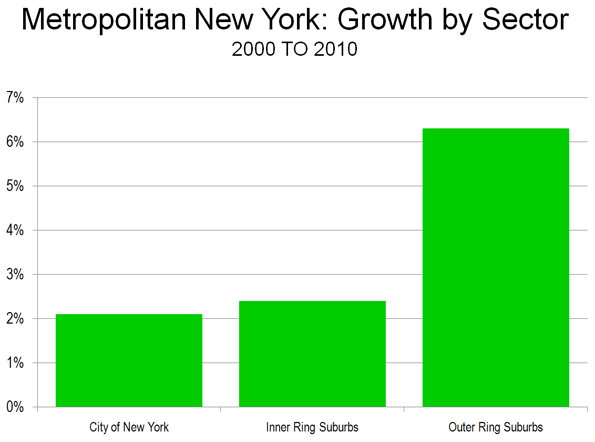
Suburbanization Accelerating Again: If you had read the New York Times and other Manhattan-based media over the last decade you would have assumed the suburbs were in decline and cities ascendant, particularly in the New York area. Yet in reality over the past decade, the suburban counties captured their largest share of New York metropolitan area growth in three decades. During the 2000s, the suburbs accounted for 71 percent of growth, up from 54 percent during the 1990s and 48 percent in the 1980s. The outer suburbs grew the fastest, while the inner suburbs – some of which are denser than historical core municipalities in other metropolitan areas – grew faster than the historical core municipality, the city of New York (Figure 1 and Table)
| NEW YORK METROPOLITAN AREA | ||||
| POPULATION TREND BY COUNTY: 2000 TO 2010 | ||||
| 2000 | 2010 | Change | % | |
| HISTORIC CORE MUNICIPALITY (New York) | ||||
| Bronx County, NY | 1,332,650 | 1,385,108 | 52,458 | 3.9% |
| Kings County, NY | 2,465,326 | 2,504,700 | 39,374 | 1.6% |
| New York County, NY | 1,537,195 | 1,585,873 | 48,678 | 3.2% |
| Queens County, NY | 2,229,379 | 2,230,722 | 1,343 | 0.1% |
| Richmond County, NY | 443,728 | 468,730 | 25,002 | 5.6% |
| Subtotal | 8,008,278 | 8,175,133 | 166,855 | 2.1% |
| INNER SUBURBAN | ||||
| Bergen County, NJ | 884,118 | 905,116 | 20,998 | 2.4% |
| Essex County, NJ | 793,633 | 783,969 | (9,664) | -1.2% |
| Hudson County, NJ | 608,975 | 634,266 | 25,291 | 4.2% |
| Middlesex County, NJ | 750,162 | 809,858 | 59,696 | 8.0% |
| Nassau County, NY | 1,334,544 | 1,339,532 | 4,988 | 0.4% |
| Passaic County, NJ | 489,049 | 501,226 | 12,177 | 2.5% |
| Union County, NJ | 522,541 | 536,499 | 13,958 | 2.7% |
| Westchester County, NY | 923,459 | 949,113 | 25,654 | 2.8% |
| Subtotal | 6,306,481 | 6,459,579 | 153,098 | 2.4% |
| OUTER SUBURBAN | ||||
| Hunterdon County, NJ | 121,989 | 128,349 | 6,360 | 5.2% |
| Monmouth County, NJ | 615,301 | 630,380 | 15,079 | 2.5% |
| Morris County, NJ | 470,212 | 492,276 | 22,064 | 4.7% |
| Ocean County, NJ | 510,916 | 576,567 | 65,651 | 12.8% |
| Pike County, PA | 46,302 | 57,369 | 11,067 | 23.9% |
| Putnam County, NY | 95,745 | 99,710 | 3,965 | 4.1% |
| Rockland County, NY | 286,753 | 311,687 | 24,934 | 8.7% |
| Somerset County, NJ | 297,490 | 323,444 | 25,954 | 8.7% |
| Suffolk County, NY | 1,419,369 | 1,493,350 | 73,981 | 5.2% |
| Sussex County, NJ | 144,166 | 149,265 | 5,099 | 3.5% |
| Subtotal | 4,008,243 | 4,262,397 | 254,154 | 6.3% |
| SUBTOTAL: SUBURBAN | 10,314,724 | 10,721,976 | 407,252 | 3.9% |
| TOTAL | 18,323,002 | 18,897,109 | 574,107 | 3.1% |
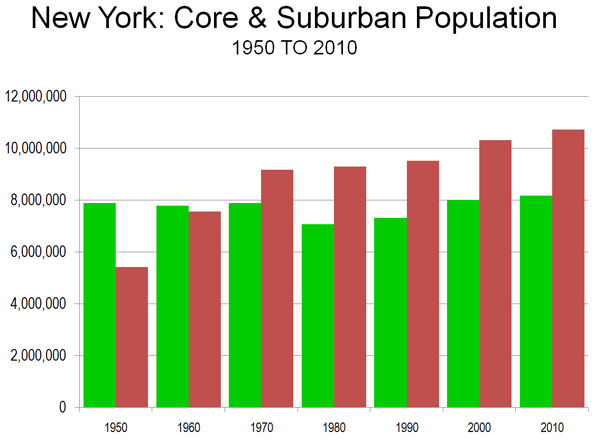
Critically, the city of New York did worse than at any time since the 800,000 population loss that was sustained in the 1970s, representing all of the loss since 1950. Between 1950 and 1980 the suburbs added 3.9 million residents. The city’s fortunes had improved measurably in the 1980s and 1990s, with approximately one-half of the metropolitan area’s growth. The last decade’s share of metropolitan area growth – only 29 percent – in the historical core municipality indicates a startling acceleration of dispersion, although fortunately not a return to the population decline of the 1970s (Figure 2).
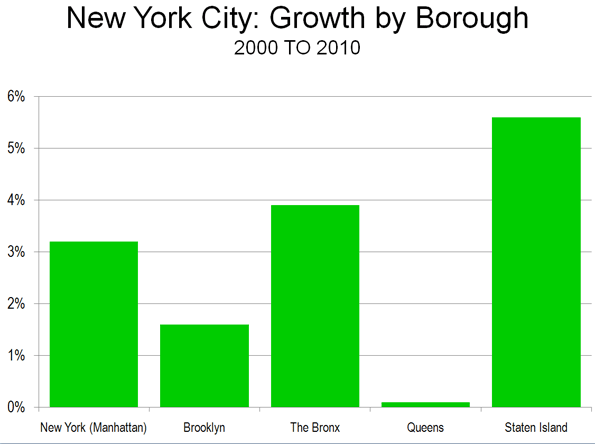
City of New York: The city of New York grew from 8,008,000 to 8,175,000 between 2000 and 2010, a rate of 2.1 percent.
Staten Island (Richmond County), which is largely suburban in form, was the fastest growing of New York’s boroughs, with a growth rate of 5.6 percent. The Bronx grew the second fastest, at a rate of 3.9 percent. Only Staten Island and Queens (below) reached their population peaks in the 2010 census (Figure 3).
The Bronx has experienced perhaps the nation’s most successful urban turn-arounds, after a disastrous period in the 1970s and 1980s, when large swaths of the South Bronx were literally leveled. The population fell from 1,472,000 in 1970 to 1,204,000 in 1990. By 2010, the population had recovered nearly two-thirds of the loss, to 1,385,000.
Manhattan (New York County) added 3.2 percent to its population (49,000) and reached 1,586,000. This is approximately one-third below its population peak of 2,232,000 in 1910. Manhattan’s population, however, remained approximately 45,000 below the Census Bureau estimates.
Brooklyn (Kings County) continues to be the largest borough in New York, with 2,505,000 residents, an increase of 39,000 (1.6 percent) between 2000 and 2010. Brooklyn reached its population peak of 2,738,000 in 1950. Brooklyn’s population proved approximately 75,000 below the Census Bureau’s estimates.
The slowest growing borough was Queens, which added only 2,000 residents (a 0.1 percent population increase), yet reached its population peak of 2,231,000. Queens had added more residents than any other borough since 1950 and added approximately 275,000 residents in the 1990 to 2000 census period.
Inner Ring Suburbs: The inner ring counties (Nassau, Westchester, Bergen, Passaic, Essex, Hudson, Union and Middlesex) grew 2.4 percent from 6,306,000 to 6,460,000. Growth rates varied significantly, from a loss of 1.2 percent in Essex County (where Newark is located) to 8.0 percent in Middlesex County. Middlesex County includes newer suburban areas further away from the core than in any other inner ring county. Much of the Middlesex County growth occurred in these areas. The inner ring suburbs captured 26.7 percent of the metropolitan area growth.
Outer Ring Suburbs: By far the e fastest growth was in the outer ring counties, with a population increase of 6.3 percent, from 4,008,000 to 4,262,000. Monmouth County was the slowest growing outer ring county, adding 2.5 percent to its population. Pike County, Pennsylvania, which is the farthest to the west of any county in the metropolitan area, had by far the highest growth rate, at 23.8 percent. Ocean County, New Jersey, had the second fastest growth rate, at 12.8 percent. Ocean County lies at the extreme southern end of the metropolitan area. The outer ring counties captured 44.3 percent of the metropolitan area growth.
Suburban Growth and Projections: Overall suburban growth was from 10,314,000 to 10,712,000, for a gain of 407,000 (4.0 percent). This was above the Census Bureau estimate of 392,000. The suburbs now contain 57 percent of the metropolitan area population.
New York’s Continuing Dispersion: The dispersion of the 2000s is an extension of the overall metropolitan area trend since 1950 (Note). The historical core municipality, New York, has added less than 300,000 residents, or 3.6 percent. The suburbs have added 5.3 million residents, nearly doubling their population. Approximately 95 percent of the metropolitan area’s growth was in the suburbs between 1950 and 2010 (Figure 4).
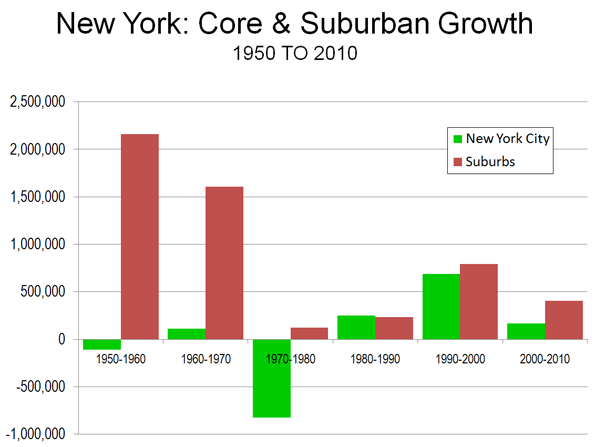
The dispersion is apparent even in the city of New York. Since 1950, Queens, the outermost of the inner four boroughs, added nearly 700,000 residents, while the more inner boroughs of Manhattan, Brooklyn and the Bronx, lost nearly as many residents. Overall these four inner boroughs gained only 6,000 residents since 1950. Staten Island, which is largely post-war suburban, grew 277,000, while the city overall was growing by 283,000, leaving only a net gain of 6,000 for the four inner boroughs of New York.
A recent newgeography.com article documents similar patterns in employment dispersion and commuting during the 1990 to 2008 period.
Consistency with the National Trend: The accelerating suburbanization of New York is consistent with the national trends in major metropolitan areas in the new census data. Between 1990 and 2000, historical core municipalities accounted for 15 percent of metropolitan area growth. Between 2000 and 2010, the share of historical core municipality growth had fallen to 9 percent.
Note: This analysis is based upon the metropolitan area boundaries as currently defined.
Wendell Cox is a Visiting Professor, Conservatoire National des Arts et Metiers, Paris and the author of “War on the Dream: How Anti-Sprawl Policy Threatens the Quality of Life”
Photo by Mike Lee


