
Perhaps the most surprising development in urban areas over the past year was the ascendancy of Delhi to rank second in the world in population, following only Tokyo – Yokohama. Based upon the new United Nations population estimate, the 7th annual edition of Demographia World Urban Areas places Delhi's population at 22.6 million. Tokyo – Yokohama, however, is in no immediate jeopardy of losing its number one status, with a population estimated at 36.7 million, approximately 70 percent greater than that of Delhi (Note 1). Demographia World Urban Areas includes population estimates for all identified urban areas in the world with 500,000 or more residents. Among these 796 urban areas, 169 are in higher income nations and 627 are in lower income nations.
The Largest Urban Areas: For years, demographers have been watching Mumbai on the assumption that it might eventually emerge as the largest urban area outside Tokyo – Yokohama. However, Mumbai, at 21.3 million, has fallen behind faster growing Delhi and now ranks as the sixth largest urban area in the world. Seoul-Incheon, in Korea, has emerged as the number three urban area, based upon higher than anticipated suburban growth registered in the 2010 census and now shows a population of 22.5 million. Jakarta, Indonesia's capital, now stands as number four, with a population of 22.2 million, followed by number five Manila at 21.3 million (Note 2). The next three largest world urban areas are in the Americas with New York at 20.7 million, Sao Paulo at 20.4 million and Mexico City at 19.6 million. The world's 10th largest urban area is Shanghai (18.7 million), which experienced larger than anticipated growth toward the end of the decade (Table).
| 10 Largest Urban Areas in the World: 2011 | ||||||||
|
Rank
|
Geography | Urban Area |
Current Year Population Estimate
|
Land Area: Square Miles
|
Density
|
Land Area: Km2
|
Density
|
Density Year
|
| 1 | Japan | Tokyo-Yokohama |
36,690,000
|
3,500
|
10,500
|
9,065
|
4,000
|
2011
|
| 2 | India | Delhi, DL-HAR-UP |
22,630,000
|
605
|
37,000
|
1,567
|
14,300
|
2011
|
| 3 | South Korea | Seoul-Incheon |
22,525,000
|
835
|
27,000
|
2,163
|
10,400
|
2011
|
| 4 | Indonesia | Jakarta |
22,245,000
|
1,075
|
20,400
|
2,784
|
7,900
|
2011
|
| 5 | Philippines | Manila |
21,295,000
|
550
|
37,000
|
1,425
|
14,300
|
2009
|
| 6 | India | Mumbai, MAH |
21,290,000
|
300
|
70,300
|
777
|
27,100
|
2011
|
| 7 | United States | New York, NY-NJ-CT |
20,710,000
|
4,349
|
4,500
|
11,264
|
1,800
|
2000
|
| 8 | Brazil | Sao Paulo |
20,395,000
|
1,125
|
18,100
|
2,914
|
7,000
|
2011
|
| 9 | Mexico | Mexico City |
19,565,000
|
780
|
25,000
|
2,020
|
9,700
|
2011
|
| 10 | China | Shanghai |
18,665,000
|
1,125
|
16,500
|
2,914
|
6,400
|
2011
|
Among the top ten urban areas, New York is by far the least dense, followed by Tokyo-Yokohama. They are also the most affluent, with seven of the remaining 10 far more dense and located in lower income countries, while Seoul-Incheon is more dense, but in a nation that is among the latest entrants to higher income status (Figures 1 & 2).
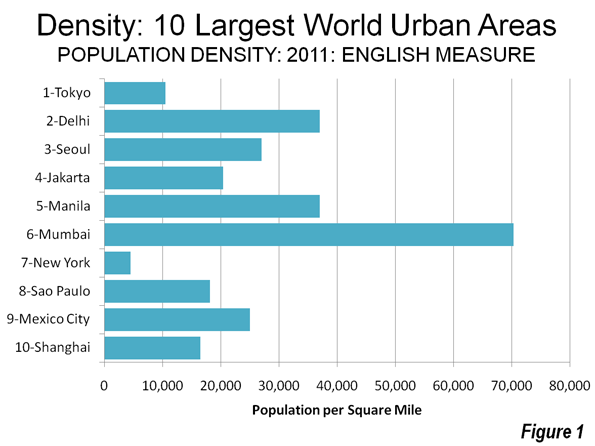
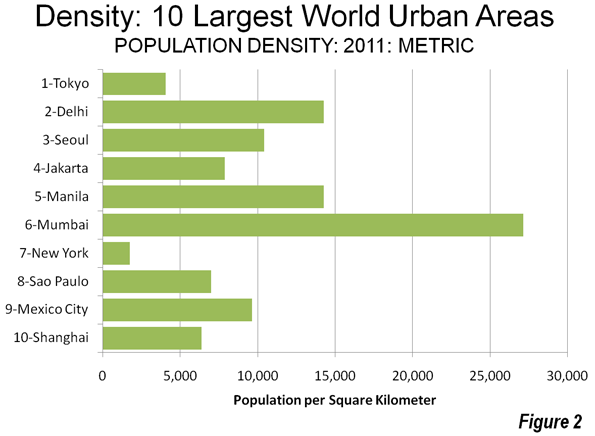
Highest Population Densities: Dhaka, the capital of Bangladesh is the most dense with 90,600 persons per square mile or 35,000 per square kilometer. Dhaka ranks 24th in population in the world and crowds its approximately 11.5 million residents into 125 square miles or 325 square kilometers (less than the land area of the municipality of Portland, Oregon). Mumbai ranks second in population density, with 70,300 per square mile or 27,100 percent per square kilometer. Among high income urban areas, Macau is the most dense, at 70,000 per square mile or 27,000 per square kilometer, slightly ahead of its neighbor across the Pearl River, Hong Kong, which is estimated to have 66,100 residents per square mile or 25,500 per square kilometer. Of course, both Hong Kong and Macau have artificially high densities, driven by their enclave status. Comparatively few urban areas in the high income world exceed 15,000 per square mile (6,000 per square kilometer).
Largest Urban Land Area: Although we commonly identify Gotham with the density of high-rise Manhattan, New York sprawls more than any of the top urban areas. Its urban area contains far the largest land area, stretching to cover 4,350 square miles or 11,300 square kilometers. Los Angeles, more noted for its physical expanse, has approximately one-half the land area of New York and it extends less than both Tokyo – Yokohama and Chicago. Perhaps astonishingly, the Boston urban area covers approximately 95 percent of the land area of Los Angeles, though with only one-third the population.
Larger Urban Areas, Higher Density: As urban areas become larger, their population densities also increase. Moreover, as in the top 10 urban areas, lower income nations tend to have far higher densities than the urban areas located in the higher income nations(Figures 3 & 4).
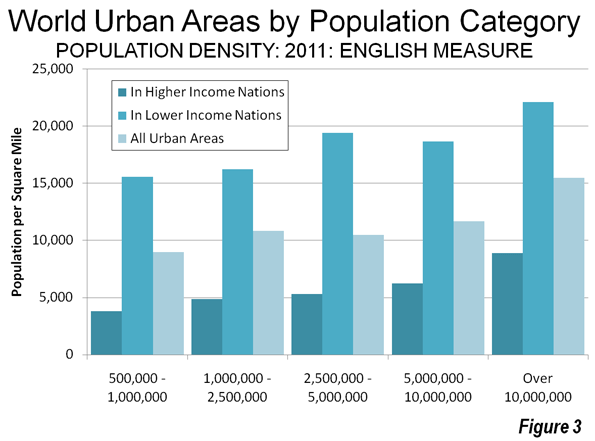
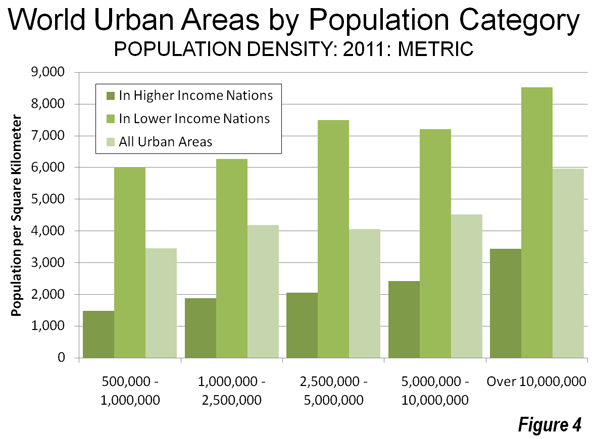
- Overall urban densities are approximately 9,000 per square mile (3,500 per square kilometer) in urban areas with between 500,000 and 1 million population and rise to 15,500 per square mile (6,000 per square kilometer) among urban areas with more than 10 million population.
- Urban areas in higher income nations range from a population density of 3,800 per square mile (1,500 per square kilometer) among urban areas with from 500,000 to 1,000,000 population. Larger urban areas with more than 10 million population average o 8,900 per square mile (3,400 per square kilometer).
- The urban areas located in lower income nations have far higher densities densities, ranging from 15,100 per square mile (6,000 per square kilometer) in the 500,000 to 1,000,000 population category and up to 22,100 residents per square mile (8,500 per square kilometer) in the over 10 million population category.
Population Density by Region: There is also considerable variation in urban population densities between the regions of the world (Figures 5 & 6).
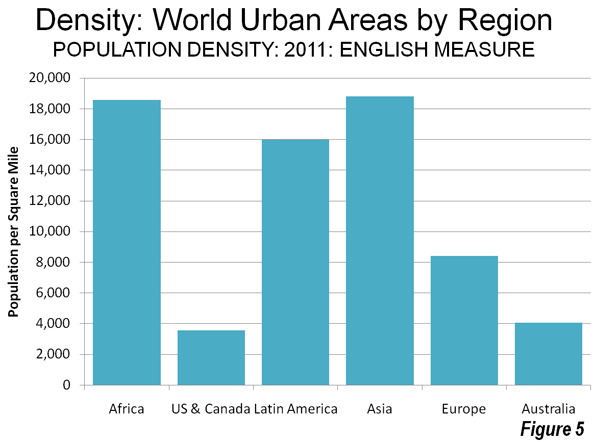
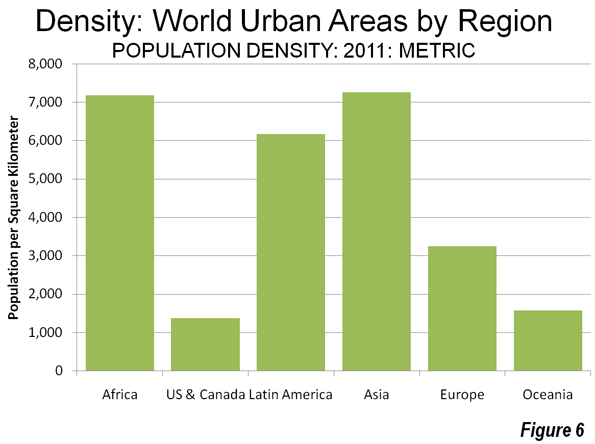
The lowest densities are in affluent areas. The United States and Canada, at 3,600 per square mile (1,400 per square kilometer), Oceania at 4,100 per square mile (1,600 per square kilometer) and Europe at 8,400 per square mile (3,200 per square kilometer). Latin American urban densities are 15,900 per square mile (6,200 per square kilometer), followed by Africa at 18,600 per square mile (7,200 per square kilometer) and Asia, at 18,800 per square mile (7,300 per square kilometer).
The overall population density of urban areas with more than 500,000 residents in India is estimated at 37,000 per square mile (14,400 per square kilometer), which is more than double that of China, at 17,000 per square mile (6,700 per square kilometer).
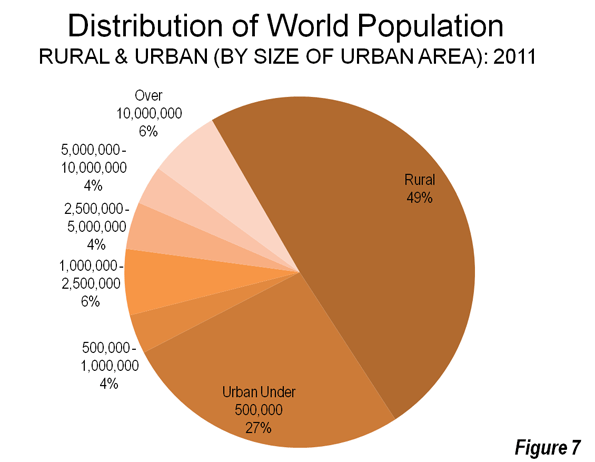
A Smaller Urban World? A review of the size of the world urban areas shows the planet to be made up principally of rural areas and towns and cities with less than 500,000 population. In 2011, approximately 51 percent of the world is urban and 49 percent is rural. Urban areas ranging from just a few thousand residents to under 500,000 residents account for 27 percent of the world's population, which constitutes a majority of its urban population. Among the larger urban areas, megacities (10,000,000 and larger) and the urban areas with between 1 million people and 2.5 million people each for approximately 6 percent of the world population. The other larger categories of urban areas each account for approximately 4 percent of the world's population (Figure 5).
The McKinsey Global Institute recently reported that the world's megacities were growing less quickly than the other large urban areas. This development, along with the distribution of world urban population may indicate that world's largest urban areas, especially the megacities, may not be the wave of the future; instead it may be smaller urbanized regions between 500,000 and 10 million. These regions, with three times the population of the megacities, will likely shape urbanity over the next few decades.
----------------
Note 1: An urban area is an urban agglomeration or an urban footprint (area of continuous development). An urban area is the organism of the “city” in its spatial dimension. Census authorities in a number of nations have adopted similar definitions for urban areas (Examples are United States, Canada, United Kingdom, France, Norway, Sweden and Australia). Demographia World Urban Areas uses national census bureau data for both population and land area estimates where it is available and estimates urban land area from satellite imagery for all others.
Note 2: for the purposes of this analysis, higher income urban areas are generally in nations with a gross domestic product of $20,000 per capita, purchasing power parity.
Note 3: The urban area population estimates of Seoul-Incheon, Jakarta and Manila are considerably of love those reported by the United Nations. The United Nations data for these urban areas is based upon a far smaller definition of urbanization than is used in other urban areas. As additional explanatory notes are found in Demographia World Urban Areas.
Photo: India Gate, Delhi (by author)
Wendell Cox is a Visiting Professor, Conservatoire National des Arts et Metiers, Paris and the author of “War on the Dream: How Anti-Sprawl Policy Threatens the Quality of Life”


