
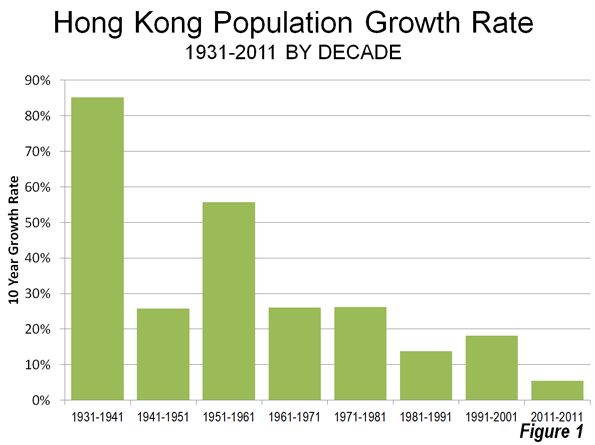
Hong Kong has experienced its slowest decadal growth in at least 70 years, according to the results of the recently released 2011 census. Between 2001 and 2011, Hong Kong added only 5.4 percent to its population, a decline of more than two-thirds from its 1991-2001 rate. Hong Kong's slowest growth rate since 1921-1931 was between 1981 and 1991, when 13.8 percent was added to its population. In previous decades growth had been much greater (Figure 1).
Further, despite Hong Kong's much larger population base today, the numeric growth from 2001 to 2011 was also the smallest since the 1921-1931 decade. Hong Kong added 363,000 residents for a total of 7,072,000 in 2011. The increase is barely one-third of the 1,034,000 residents added between 1991 and 2001. Much of Hong Kong's population growth in the last 60 years had been driven by its better standard of living relative to mainland China. It seems likely that the growing prosperity of the past decade on the mainland has made Hong Kong less attractive for migrants.
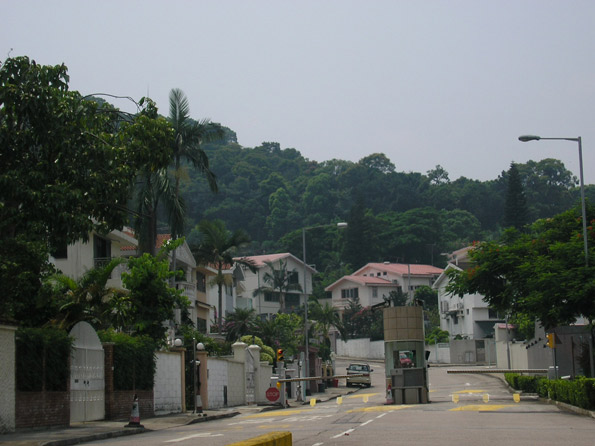
High Income World's Most Dense Urban Area: Hong Kong continues to be the densest major urban area in the high-income world. The present density is estimated at 67,000 per square mile (26,000 per square kilometer). At least one small area of Hong Kong has a population density exceeding 1 million per square mile (400,000 per square kilometer), though the much more dense Kowloon Walled City (estimated at up to 5,000,000 per square mile or 2,000,000 per square kilometer) was demolished in the 1990s. Even so, there are now detached housing developments, as Hong Kongers who can afford it choose these much more expensive accommodations, as Witold Rybczynski relates in a recent commentary (detached housing photo).
Detached Housing
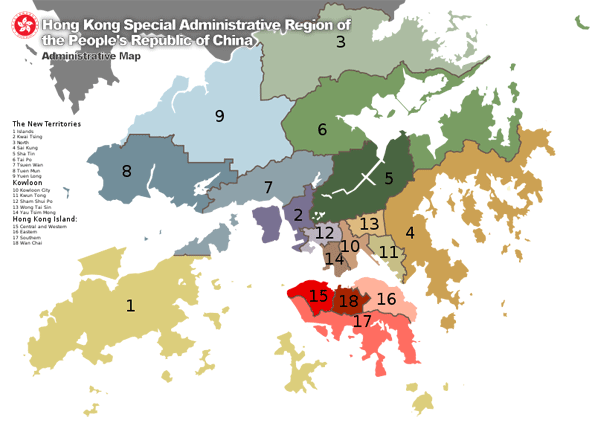
Subdivisions of Hong Kong: The Hong Kong Special Administrative Region (HKSAR) is a unified government, with no local jurisdictions (such as cities or towns). However, there are four broad regions and within each there are districts, are designated for statistical purposes.
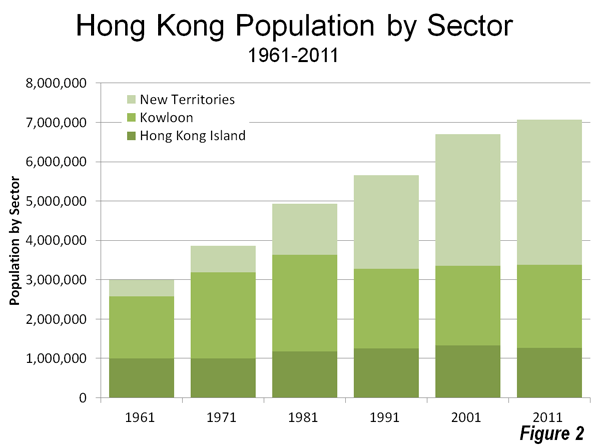
Hong Kong's growth --- like that of most major metropolitan areas --- has been shifting to the periphery for decades (Table 1). Between 1981 and 2011, all of the population growth was in the New Territories, the new (greenfield and high density) suburban areas beyond the Hong Kong Island-Kowloon core. While all of Hong Kong was adding 2.1 million residents in total between 1981 and 2011, the New Territories added 2.4 million (Table 2). This suburban dominance continued in the last census period, with 96 percent of growth in the New Territories. Before that, the bulk of the growth was in the outer areas of Kowloon, which were then the suburbs (Figure 2).
| Table 1 | |||||
| Hong Kong Population by District: 1911-2011 | |||||
| Year | Total | Hong Kong | Kowloon | New Territories | Marine |
| 1911 | 456,700 | 244,300 | 69,400 | 81,200 | 61,800 |
| 1921 | 625,200 | 347,400 | 123,400 | 83,200 | 71,200 |
| 1931 | 840,500 | 409,200 | 263,000 | 98,200 | 70,100 |
| 1941 | 1,600,000 | Estimate: No complete census | |||
| 1951 | 2,013,000 | Estimate: Census cancelled | |||
| 1961 | 3,129,600 | 1,004,900 | 1,578,000 | 409,900 | 136,800 |
| 1971 | 3,936,600 | 996,200 | 2,194,800 | 665,700 | 79,900 |
| 1981 | 4,986,600 | 1,183,600 | 2,449,100 | 1,304,100 | 49,700 |
| 1991 | 5,674,100 | 1,251,000 | 2,030,700 | 2,374,800 | 17,600 |
| 2001 | 6,708,400 | 1,335,500 | 2,024,000 | 3,343,000 | 5,900 |
| 2011 | 7,071,600 | 1,270,900 | 2,108,400 | 3,691,100 | 1,200 |
| Sources: | |||||
| Government of Hong Kong | |||||
| www.cicred.org/Eng/Publications/pdf/c-c21.pdf | |||||
| Table 2 | ||||||||
| Hong Kong Population by District: 1991-2011 | ||||||||
| Region & District | Population: 1991 | Population: 2001 | Population: 2011 | % 2001-2011 | Land Area KM2 | Land Area MI2 | Density KM2 | Density MI2 |
| HONG KONG | 5,674,114 | 6,708,389 | 7,071,576 | 5.4% | 1,098 | 424 | 6,440 | 16,680 |
| HONG KONG ISLAND | 1,250,993 | 1,335,469 | 1,270,876 | -4.8% | 80 | 31 | 15,827 | 40,991 |
| Central and Western | 253,383 | 261,884 | 251,519 | -4.0% | 13 | 5 | 20,089 | 52,031 |
| Wan Chai | 180,309 | 167,146 | 152,608 | -8.7% | 10 | 4 | 15,230 | 39,447 |
| Eastern | 560,200 | 616,199 | 588,094 | -4.6% | 19 | 7 | 31,265 | 80,976 |
| Southern | 257,101 | 290,240 | 278,655 | -4.0% | 39 | 15 | 7,154 | 18,529 |
| KOWLOON | 2,030,683 | 2,023,979 | 2,108,419 | 4.2% | 47 | 18 | 45,138 | 116,909 |
| Yau Tsim Mong | 282,060 | 282,020 | 307,878 | 9.2% | 7 | 3 | 44,946 | 116,409 |
| Sham Shui Po | 380,615 | 353,550 | 380,855 | 7.7% | 9 | 4 | 40,175 | 104,052 |
| Kowloon City | 402,934 | 381,352 | 377,351 | -1.0% | 10 | 4 | 37,849 | 98,028 |
| Wong Tai Sin | 386,572 | 444,630 | 420,183 | -5.5% | 9 | 4 | 44,891 | 116,268 |
| Kwun Tong | 578,502 | 562,427 | 622,152 | 10.6% | 11 | 4 | 56,303 | 145,826 |
| NEW TERRITORIES | 2,374,818 | 3,343,046 | 3,691,093 | 10.4% | 971 | 375 | 3,801 | 9,845 |
| Kwai Tsing | 440,807 | 477,092 | 511,167 | 7.1% | 22 | 8 | 23,427 | 60,675 |
| Tsuen Wan | 271,576 | 275,527 | 304,637 | 10.6% | 61 | 23 | 5,019 | 12,999 |
| Tuen Mun | 380,683 | 488,831 | 487,546 | -0.3% | 84 | 33 | 5,773 | 14,953 |
| Yuen Long | 229,724 | 449,070 | 578,529 | 28.8% | 138 | 53 | 4,179 | 10,824 |
| North | 165,666 | 298,657 | 304,134 | 1.8% | 137 | 53 | 2,215 | 5,737 |
| Tai Po | 202,117 | 310,879 | 296,853 | -4.5% | 147 | 57 | 2,014 | 5,215 |
| Sha Tin | 506,368 | 628,634 | 630,273 | 0.3% | 69 | 27 | 9,074 | 23,501 |
| Sai Kung | 130,418 | 327,689 | 436,627 | 33.2% | 136 | 53 | 3,201 | 8,291 |
| Islands | 47,459 | 86,667 | 141,327 | 63.1% | 175 | 68 | 807 | 2,091 |
| MARINE | 17,620 | 5,895 | 1,188 | -79.8% | 0 | 0 | 0 | 0 |
| Data from Government of Hong Kong Special Administrative Region | ||||||||
The Core: Hong Kong Island: Hong Kong Island, home to one of the world's most dense central business districts (Central, Western and Wan Chai districts) lost 4.8 percent of its population. All five of the districts on Hong Kong Island lost population, with Wan Chi (of "The World of Suzy Wong" movie fame) suffering the greatest loss, at 8.7 percent).
The Core: Kowloon: Across Hong Kong harbor (see Star Ferry photograph, top), Kowloon, also a part of the core, gained 4.2 percent, adding nearly 75,000 residents (photo). Even so, Kowloon's population remains more than 10 percent below its 1981 population. Three of Kowloon's five districts gained population, including Yau Sim Mong and Sham Shui Po, which along with the north shore districts of Hong Kong Island are the most intensely developed in the HKSAR.
Suburban: The New Territories: The New Territories added 10.4 percent to their population (348,000), with seven of the nine districts gaining. The largest gain (63 percent) was in the Islands district, which includes Hong Kong International Airport. Sia Kung, also grew strongly, at 33 percent (see photo). Sia Kung, like nearly built-out Sha-Tin, is conveniently located just over a narrow mountain range from Kowloon and contains considerable amounts of greenfield land for development.
Kowloon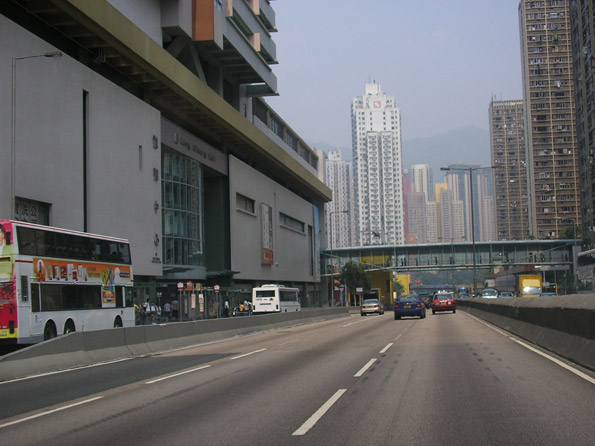
Sia Kung
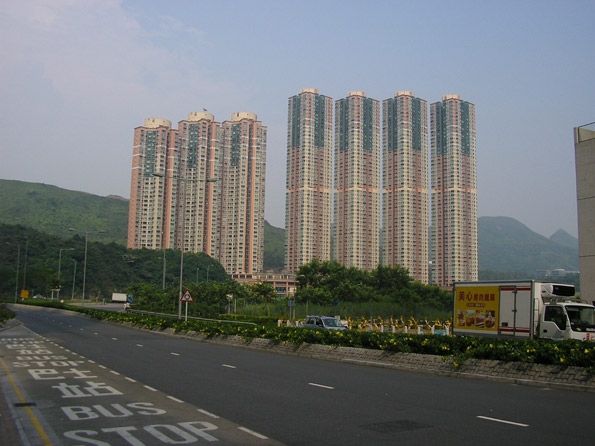
Yuen Long, home of the new Shenzhen Bridge had the third highest growth rate, at 29 percent. The Islands, Sia Kung and Yuen Long all have all experienced much improved access from extensions to the Mass Transit Railway (MTR) and the former Kowloon-Canton Railway (KCR), which have now merged into the MTR.
Transportation in Hong Kong: Hong Kong is the most transit dependent major metropolitan area in the high-income world. Mass transit carries 72 percent of motorized trips. Even with the high residential and employment density, the average work trip is approximately five miles each way. Moreover, despite having one of the most effective mass transit systems in the world and extraordinarily high densities, the average one-way work trip travel time is 46 minutes, 18 minutes longer than Los Angeles or Houston. With the highest transit market share in the world and an automobile market share only 1/70th that of Houston, Hong Kong's density still produces among the highest levels of traffic congestion in the world --- 1.5 times the traffic density of Los Angeles and three times that of Houston (photo).
Hong Kong Traffic Congestion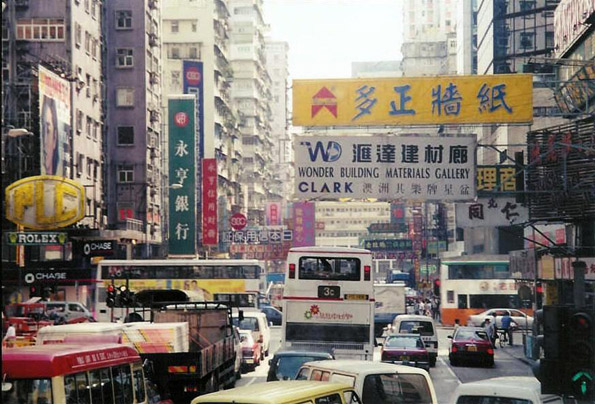
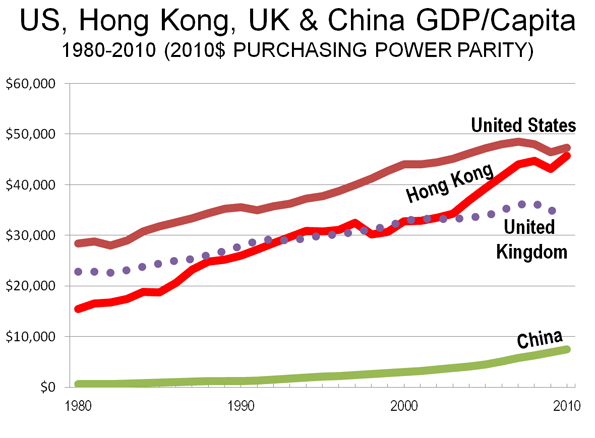
Economic Growth: Hong Kong has experienced strong economic growth for the last three decades. In 1981, Hong Kong's gross domestic product (GDP) per capita was one-third below that of the United Kingdom, its then colonial master. Even by this time, Chinese leader Deng Xiao Ping had been so impressed by Hong Kong's market based economic advance, that he had designated adjacent Shenzhen as a special economic zone. That area has since grown from a fishing village to a population exceeding 10 million, according to the 2010 census. In the intervening years, the Pearl River Delta has emerged as the most populous extent of urbanization in the world, stretching from Hong Kong, through Shenzhen, Dongguan, Guangzhou, Jiangmen, Zhongshan and Zhuhai to Macao. However, because of border controls and the low level of commuting, these remain separate metropolitan areas and urban areas.
Hong Kong's economic growth continued strongly in the middle 1990s, when its GDP per capita exceeded that of the United Kingdom. Hong Kong fell behind in the late 1990s Asian economic crisis, but soon recovered. By 2010, Hong Kong's GDP per capita had risen to 27 percent above that of the United Kingdom.
Hong Kong's economic performance relative to the United States may be even more impressive. In 1980, Hong Kong's GDP per capital trailed that of the United States by 45 percent. As of 2010, Hong Kong trailed the US by only three percent and according to International Monetary Fund data should pass the United States early in the present decade. Between 2000 and 2010, Hong Kong's per capita GDP (PPP-2010$) rose more than one-third --- only South Korea and Singapore did better among high-income areas, according to International Monetary Fund data. China's percentage growth rate was nearly five times Hong Kong's but in actual dollars Hong Kong's GDP per capita rose at triple China's rate. However, should China's economy slow down, as some analysts suggest, it could be difficult for Hong Kong to sustain this strong growth rate (Figure 3).
The People's Republic of China has maintained Hong Kong's free market economic system, helping assure strong growth. It seems unlikely that either Deng Xiao Ping or Margaret Thatcher imagined that such economic progress would be made when they signed the historic agreement to restore Hong Kong to China in 1984. Nor is it likely they imagined China's meteoric rise.
Unique Hong Kong: Hong Kong is the living model of compact development and transit dependence toward which urban planning wisdom strives. However, Hong Kong itself is the outlier of outliers. Hong Kong's population density --- double that of any other high-income world urban area of similar size or larger --- would never have approached this level if it had not been separated from China itself by colonization and then the historical complexities of the post-World War II period. Even in its prosperity, the growing urban areas of mainland China are being built at densities averaging no more than one-quarter that of Hong Kong. Hong Kong may be more an accident of history than an exemplar.
Wendell Cox is a Visiting Professor, Conservatoire National des Arts et Metiers, Paris and the author of “War on the Dream: How Anti-Sprawl Policy Threatens the Quality of Life”
----
Photo: Star Ferry, operating between Hong Kong Island (Central) and Kowloon (Yau Tsim Mong). All photos by author.
Hong Kong district map by Wikipedia user Moddlyg.


Located at the Stratton
Located at the Stratton enclave in the Yio Chu Kang landed district, Belgravia Villas boasts of the exclusivity of landed living in a uptown neighbourhood. With Ang Mo Kio Avenue 5 nearby, transport is convenient, whether by car or by public transport. Combined with facilities such as a lap pool, gym, and communal gardens, residents can enjoy condominium-style facilities in a landed housing setting. belgravia villas