.jpg")
Large declines in fertility will depend on raising female literacy above 80%.
Every few years, the United Nations Population Division releases demographic projections for the entire world and for every country, region and continent. Although the UN’s database is the most used source on demographics, the data is not equally reliable for all countries.
Countries in the developed world conduct regular censuses and produce detailed numbers that are considered reliable. Less developed countries conduct censuses on an irregular basis or are completely unable to conduct them and have instead to rely on demographic sampling. In the poorest countries of the world, most of which are in sub-Saharan Africa, censuses are infrequent or nonexistent and even sampling can be irregular and unreliable.
This poses a problem today because the biggest population growth by far is expected to take place in these same poor countries. In order to get a fair picture of the world population in the 21st century, we need to get reliable data from the fastest growing region.
François Pelletier who heads the UN’s Population Estimates and Projections Section told populyst that he considers the data for the next 35 years, that is the projections for the years 2015-2050, to be fairly reliable, with greater confidence in the near years than in the later years. The further the horizon of the projections, the greater the uncertainty. In this regard, Pelletier suggested that the projections beyond 2075, especially those focusing on the median trajectory at the country level, be treated with some degree of caution.
This makes perfect sense because a small change in the assumptions for child mortality and total fertility ratios (TFR = average children per woman) will have a relatively small impact in the near years and a cumulatively larger impact in the later years.
For example, if we assume for sub-Saharan Africa a low variant fertility ratio of 4.02 children per woman in 2020-2025 instead of a medium variant closer to 4.42, the cumulative impact of this change adds up to a difference in population size of ‘only’ 80 million people after ten years, a 5% deviation, but of as many as 600 million after fifty years, a 20% deviation.
Another source of demographic projections is the Vienna-based Wittgenstein Centre and it has cast doubt on the UN’s projections for world and Africa populations. In a note written by Samir KC, the Centre argues that the UN’s projections are too high because the fertility ratio in Africa is likely to fall faster than the UN predicts.
The Centre’s rationale is reached through analogy with the Asian fertility decline between 1970 and 1990 which was steeper than is predicted by the UN for Africa. Samir KC writes (our emphasis):
Once countries urbanize and citizens become wealthier, fertility declines everywhere.
The most important factor is women’s education. Already today, an Ethiopian woman with secondary education has on average only 1.6 children, compared to a woman with no education who has 6 children.
This relationship is true across Africa (see figure).
We know that access to education is expanding across Africa. There is even talk of an education dividend.
Once all girls go to school and stay there longer, they will have fewer children, especially as they will also be exposed to a more modern lifestyle, be it through TV, the cell phone and the fact that Africa is urbanizing rapidly.
This has also been the experience in Asia. It took about 20 years in Asia for its fertility to decline from more than 5 children per woman during early 1970s to less than 3 children per woman in early 1990s.
Similarly, India took about 20 years for its fertility to decline from 4.7 children per woman in early 1980s to 3.1 by early 2000s.
With new development and the plans for the better future in the making, it won’t be a surprise if the average African family would have only three children as soon as 2035.
If that assumption bears out, then Africa cannot reach 4 billion — and the world would peak this century at below 10 billion.

So who is right, the UN or the Wittgenstein Centre?
First, let us look at what each party is projecting. Second, let us examine in greater depth the correlation between fertility ratios and female literacy. Finally, let us see if the Wittgenstein Centre’s use of the Asian precedent makes sense for Africa.
Running the Numbers

The adjoining tables (click to enlarge) show the UN’s projections for its low and medium variants. We ignore the high variant and other variants for now because our main purpose is to discuss whether the medium variant is too high, as alleged by the Wittgenstein Centre.
If we look at the two variants for the year 2050 in the table below, we can see that the difference in population size in sub-Saharan Africa is about 200 million or approximately 10% of the total, a non negligible deviation but one that does not fundamentally alter one’s view of the future. Looking further out to 2100, the difference is much more significant at nearly 1.2 billion or about 30% of the total.
Going through the same comparison for the whole world, the difference is 1 billion in 2050 and a big 4 billion in 2100, respectively 10% and 50% of the total. Also highlighted are figures for India, another high growth country.

The Wittgenstein forecast is a bit lower than the UN’s low variant and assumes a sub-Saharan fertility ratio of 3.0 instead of 3.25 for the UN. Its population estimates for Africa in 2100 is 2.6 billion people, marginally lower than the UN’s low variant which is at 3 billion. We say “marginally” only in the sense that this difference looks large but it results from a small change in assumptions starting now 85 years earlier.
Female literacy and Fertility Ratios
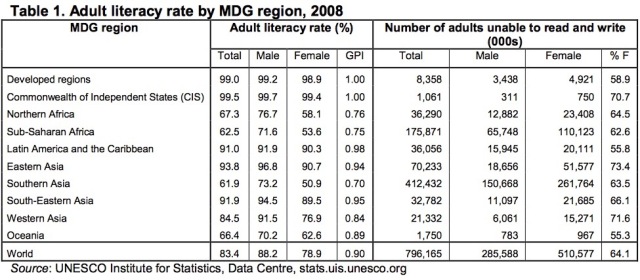
Looking at women’s education, it is clear that female literacy, the cornerstone of Wittgenstein projections, is further behind in sub-Saharan Africa than in any other region of the world. The Indian subcontinent and the Middle East/North Africa also lag the rest of the world. Table 1 below shows that the lag in female literacy has been most pronounced in Southern Asia, Africa and the Middle East (Western Asia). Encouragingly, table 2 shows that the lag is significantly narrower among younger people.

It is clear that literacy is improving in Africa. The Oxford economist Max Roser compiled this map from UNESCO data and published it on his site Our World in Data. Click on the map to use the interactive feature.
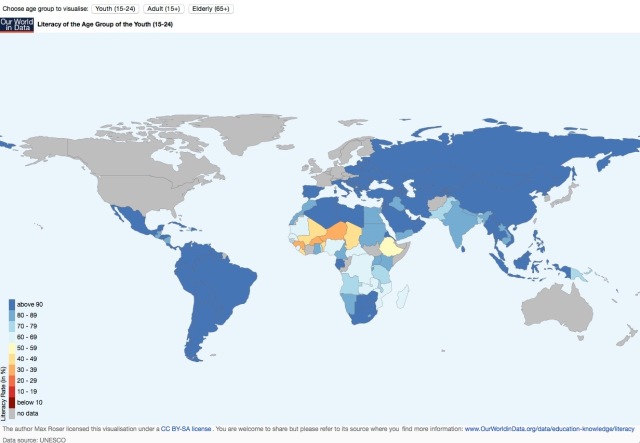
The data shows solid progress in the literacy rate for youth aged 15-24, compared to older groups. For example, 66% of Nigeria’s youth (15-24) are literate, compared to 51% for the overall adult population (defined as 15+ here) and only 22% for the elderly population (65+). Other sub-Saharan countries show a similar progression.
The countries with the highest literacy rate among the youth group are also the ones with the lowest fertility ratios. Botswana and South Africa have youth literacy rates of 95% and 99% and TFRs of 2.9 and 2.4, respectively.
One surprising data point is Kenya with a literacy rate of 82% and a TFR of 4.4. Though lower than the 5.1 sub-Saharan average, Kenya’s TFR is still quite high, suggesting that the biggest decline in fertility may occur at a literacy rate that is higher than 80% or 85%. It may be that the TFR falls slowly as literacy rises from 50% to 85% and falls rapidly as it rises from 85% to 100%.
In order to examine this hypothesis, we compiled the following tables and charts.
The table shows rates of female literacy for all sub-Saharan countries (except Congo, Somalia and South Sudan). Many of these figures may not be reliable but the trend is clear that female literacy is improving all over the African subcontinent.
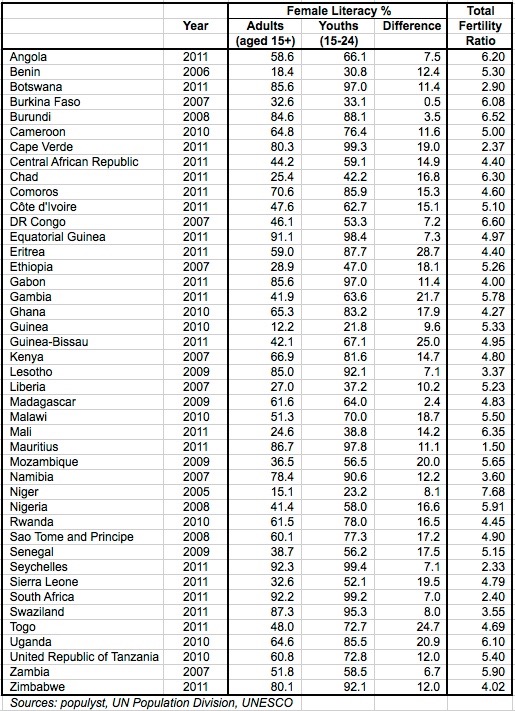
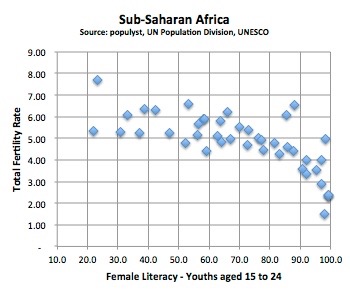
Plotting these figures, we reach the most important conclusion which is that the biggest decline in total fertility takes place after female literacy rises over 80%. Under 80%, the fall in TFRs and correlation with literacy is very weak. Excluding all countries with female adult literacy over 80%, the regression has an r-squared of only 0.29 (0.21 if the outlier Niger is also removed). Data from Burundi, Equatorial Guinea and Uganda look somewhat suspect with literacy over 80% and TFRs at 6.5, 4.97 and 6.1.

There may be cultural factors that may slow down this dynamic. In order to get a fuller picture, we looked for data on gender inequality. The United Nations Development Programme ranks countries by gender inequality. As shown in the table below, sub-Saharan African countries dominate the bottom of the ranking. It is not surprising that countries ranked lowest on the Gender Inequality Index also have the lowest female literacy and highest fertility ratios. Niger, Mali, Chad, DR Congo, Mozambique, Liberia, CAR all still have youth female literacy well below or barely above 50%. Niger looks especially challenging with a TFR of 7.7 and very low female literacy.

Non-African countries among the bottom 30 include lowest-ranked Yemen (152nd), Afghanistan (149th), Papua New Guinea (135th), Haiti (132nd), Egypt (130th), Pakistan (127th), India (127th) and Syria (125th). Nigeria and a number of others were not ranked in the latest data.
Analogy with Asia 1970-1990
Finally, does the Wittgenstein’s use of the precedent of Asia in 1970-1990 make sense for Africa now? We can see in the tables above that the fertility ratio in Asia fell from 5 in 1970 to 3 in 1990.
We can also see that China played a big role in this decline with its own TFR falling from 5 to 2. The one-child policy contributed to this accelerated decline but a big leap in literacy from about 50% to well over 90% was also a big contributor. Our hypothesis that fertility falls modestly under 80% female literacy, and collapses precipitously above 80% is supported by the Chinese experience. Literacy rose in the 1950s and 1960s but the TFR was still at 6.3 children per woman in 1965-70, very close to the 1950-55 TFR of 6.11. But twenty years later in 1985-90, female youth literacy exceeded 90% and the TFR fell to 2.75.
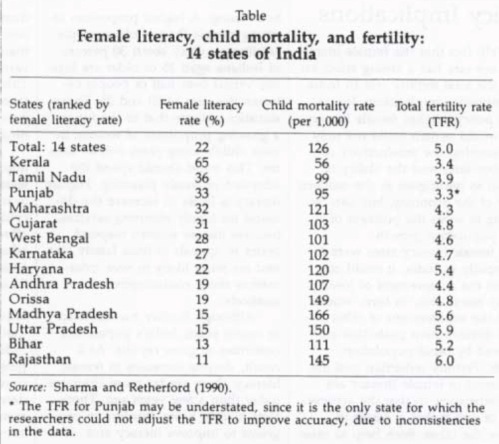
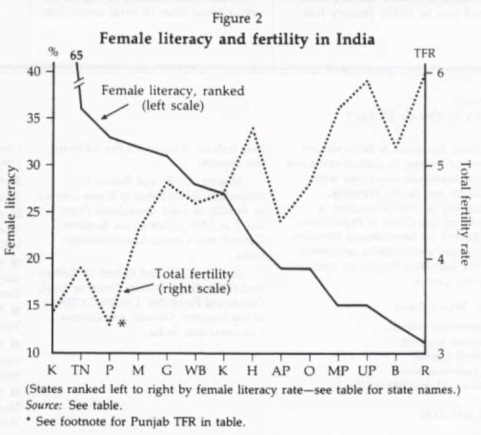
India is following a similar path with its female youth literacy ratio rising from 67.7 in 2001 to 87.2 in 2015 and its TFR falling from 3.3 in 2001 to 2.48 now. In the case of India however, the decline appears more gradual and is not obviously faster above the 80% literacy threshold. The table and graph below show that in the case of India the correlation holds well for literacy rates that are well below 80%.
Other considerations
Another way to gauge the validity of the Asia analogy is to see whether Asia was more or less developed in 1970 than sub-Saharan Africa is today. If Asia was more developed, then the analogy may not be valid and the decline in African TFR will likely be slower. In order to answer this question, we look at electricity consumption per capita as a proxy for development.
According to the World Bank, electricity consumption per capita in 1970 was 150 kilowatt hour (kWh) in China and 95 kWh in India. Below are the figures for the most populous countries in sub-Saharan Africa.

Per capita electricity consumption in Kenya and Nigeria in 2012 (most recent World Bank data) looked roughly in line with China in 1970, while DR Congo and Tanzania in 2012 looked closer to India’s consumption in 1970. In the absence of a more robust method, we could say that the TFR in Kenya and Nigeria could decline like China’s in 1970-90, while the TFR in DR Congo and Tanzania could decline like India’s, and the TFR in Ethiopia and Uganda could decline even more slowly.
Under this scenario, the TFR for Kenya and Nigeria would fall to 2 by 2035, while in DR Congo and Tanzania, it would fall to only around 4, and in Ethiopia and Uganda to a still higher level.
In a similar vein, we could look at urbanization since people living in urban areas tend to have fewer children. With the exception of Uganda, all the countries in the table appear more urbanized than China was in 1970. The percentages shown for DR Congo (42%) and Nigeria (46.9%) look suspect because they are not far below China’s current percentage of urbanization 54.4%. It looks like definitions of urbanization differ across countries and we may fall back on electricity consumption as a more reliable indicator.

Conclusion
All in, the answer to how fast African TFRs will decline remains elusive. We can however draw the following conclusions:
- Demographics are not on automatic pilot. Proactive intervention to raise female literacy, to invest in infrastructure and to improve governance will all have a significant impact on future fertility rates. Absent these measures, it should not be assumed that TFRs will decline in Africa as fast as they did in Asia. They may remain high or they may decline for other reasons such as food or water scarcity.
- The correlation between female literacy and fertility ratios is neither linear nor gradual. In the case of sub-Saharan Africa, TFRs seem to decline rapidly above 80% female literacy. Below 80%, the correlation is negligible or nonexistent.
- The recent history of Asian fertility may or may not be a reliable precedent for Africa. China’s evolution in particular was greatly impacted by government policy, including the one-child policy, the literacy campaigns and the expansion of global trade.
- Data from Africa and other less developed countries is generally unreliable. For example, it is possible that literacy rates and/or fertility rates for some African countries are inflated. It is also possible as a consequence that the relationship between literacy and fertility is in fact quite linear, as seen in the case of India.
Sami Karam is the founder and editor of populyst.net and the creator of the populyst index™. populyst is about innovation, demography and society. Before populyst, he was the founder and manager of the Seven Global funds and a fund manager at leading asset managers in Boston and New York. In addition to a finance MBA from the Wharton School, he holds a Master's in Civil Engineering from Cornell and a Bachelor of Architecture from UT Austin.
Some sources used in this article:
UNESCO Institute for Statistics: ADULT AND YOUTH LITERACY: National, regional and global trends, 1985-2015
UNESCO Institute for Statistics: ADULT AND YOUTH LITERACY: Global Trends in Gender Parity
Population Institute: How Female Literacy Affects Fertility: The Case of India
Sreemarti Chakrabarti: Women and Adult Literacy in China
World image by BigStockPhoto.com.


