
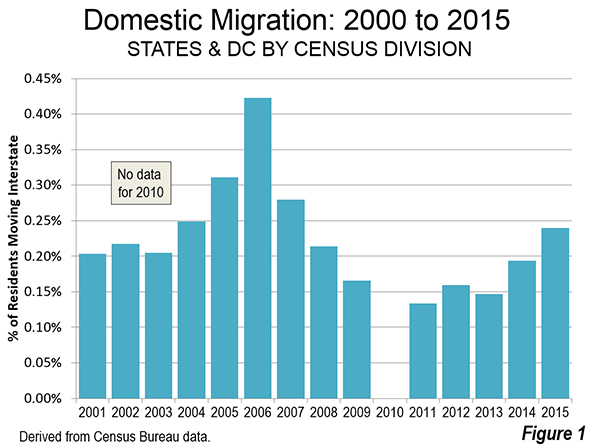
The 2015 state population estimates, recently released by the Census Bureau, indicate that interstate annual migration has begun to surge again. Between July 1, 2014 to June 30, 2015, up to 0.24% of US residents have migrated, returning to levels not experienced since the early 2000s. Interstate migration was just below the 2004 level of 0.25%, but trailed the much higher 2005 and 2006 levels (0.31% and 0.42%). By 2011, after the devastation of the housing bust and the Great Financial Crisis, interstate migration fell to 0.13% (Figure 1). In 2015, 763,000 US residents made interstate moves, the fifth highest figure since 2000. This was well below the peak of 1,251,000 in 2007 and well above the trough of 412,000 in 2011.
Regional and Divisional Trends
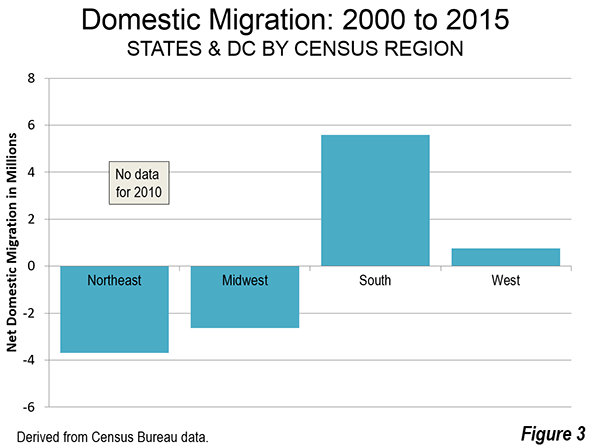
As opposed to those who claimed the Recession changed migration patterns, it turns out that domestic migrants are moving to just about the same places they did before. They continue to move principally to the South and, to a secondary degree, to the West (2000-2009 and 2010-2015, no data for 2010). The South has gained 5.6 million domestic migrants, followed by 0.8 million in the West. The Northeast has lost 3.7 million domestic migrants, while the Midwest has lost 2.7 million (Figures 2 & 3).
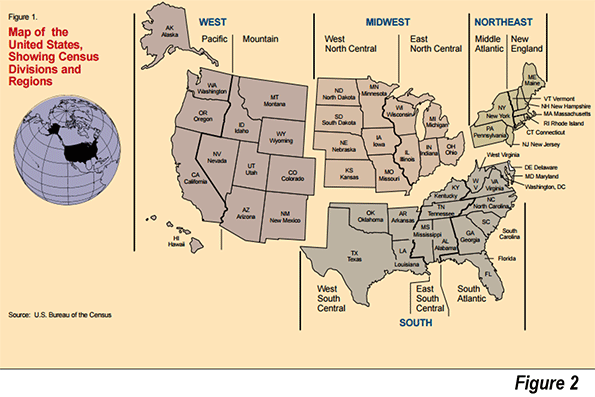
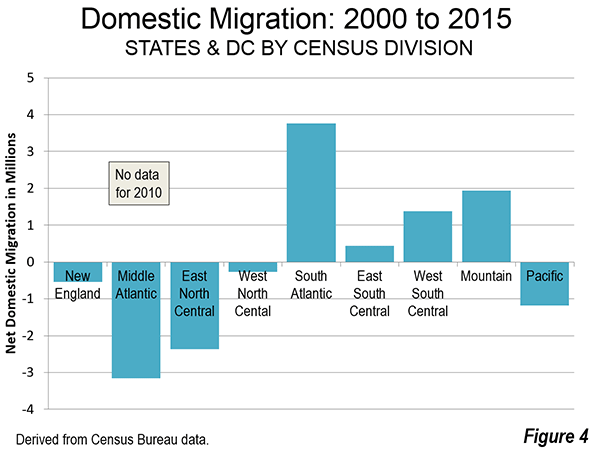
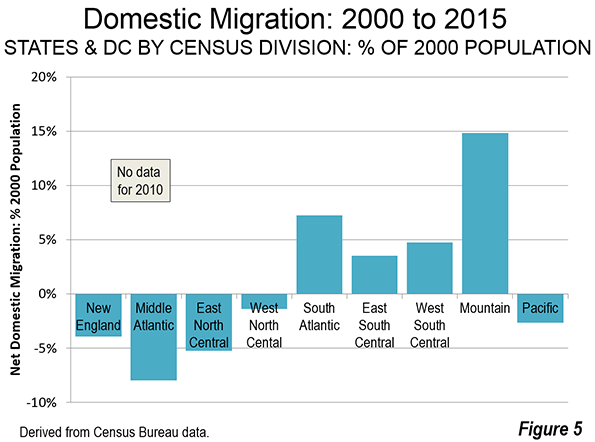
However, these regional trends mask important differences that have occurred at the division level within the regions (Figure 4). By far the most net domestic migration has been to the South Atlantic division, which stretches along the Atlantic coast from Delaware to Florida and includes West Virginia (Figure 4). The South Atlantic has added 3.8 million net domestic migrants since 2000. This is approximately double the 1.9 million gain of the Mountain division, which includes Western states that do not have a Pacific coast. The West South Central division, which includes Texas, added 1.4 million net domestic migrants, while the East South Central division, stretching from Alabama and Mississippi to Kentucky added 400,000 net domestic migrants. There were net domestic migration losses in the other divisions, including the Middle-Atlantic (New York, Pennsylvania and New Jersey), the East North Central (Ohio to Wisconsin), the Pacific (including California) and the West North Central (the Great Plains).
With its smaller population, the largest percentage gain in population from net domestic migration occurred in the Mountain division at nearly 15%. There were lesser gains in the three divisions of the South. The largest net domestic migration percentage losses were in the Middle-Atlantic, New England and East North Central divisions. The net domestic migration percentage losses were less in the Pacific division and least in the West North Central division (Figure 5).
In 2014, Northeast and the Midwest had only one state that added domestic migrants: North Dakota. Of course, with the present difficulties in the oil industry, it would not be surprising for North Dakota to fall back into its more familiar pattern of domestic migration decline in 2016. In every year since 2000, the East and Midwest have lost net domestic migrants in the aggregate. The South has gained in every year and the West in all years but one.
Out of the four divisions in the North East and Midwest, only the West North Central division has had a (single) positive year in net domestic migration in the 2000s. Similarly, the Pacific division has had only one positive net domestic migration year in the 2000s. The situation is virtually the opposite in the remaining divisions. The South Atlantic division and the Mountain division have both added net domestic migrants every year since 2000. The Texas anchored West South Central division and the East South Central division have both added net domestic migrants in 12 of the 14 years.
Early and Later Millennium
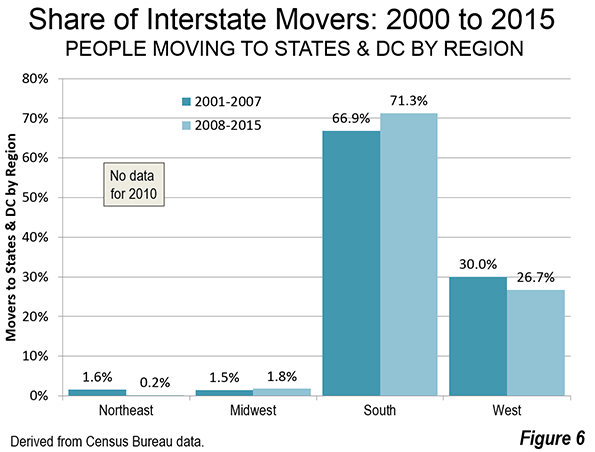
Breaking the period in two, the inflation, of the Housing Bubble (2000-2007) and the aftermath (2008-2015, except for 2010), the movement to the South recently has become somewhat stronger, while the movement to the West a bit weaker (Figure 6). The two regions captured 97 percent of net interstate migrants from 2008 to 2015. The Midwest appears to have done better in the later period, with 1.8 percent of the interstate migrants, up from 0.2 percent between 2000 and 2007. However, North Dakota alone accounts for two-thirds of the net interstate migration to the Midwest. Without North Dakota, interstate migration to the Midwest would have made up only 0.6 percent of the total.
State Highlights: 2014
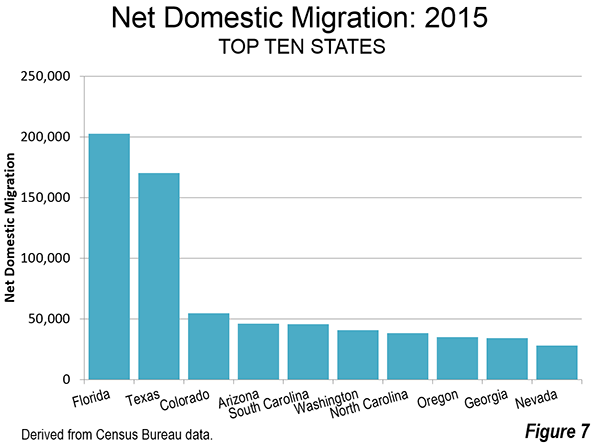
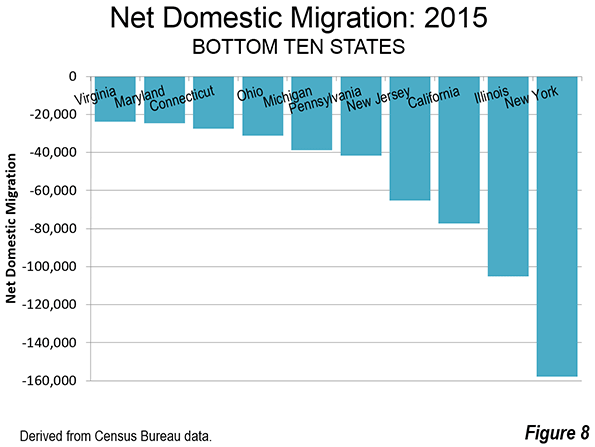
The bulk of the 763,000 net interstate migrants --- 91 percent (694,000) --- moved to the top ten states. Florida regained its lead for the first time since 2005, followed by Texas. All of the other top ten states attracted less than one-third the net domestic migrants that arrived in either Florida or Texas (Figure 7). A large majority of 763,000 net interstate migrants left the bottom ten states --- 78 percent (594,000). New York, Illinois, New Jersey and Illinois lost the most domestic migrants. Each of these states has routinely appeared at or near the bottom during since the beginning of the millennium (Figure 8).
Longer Term State Trends
Overall, eight states gained net domestic migrants in all 14 of the years since 2000 (Table). Of these, Arizona had the largest percentage gain, at 16.5%. However the greatest percentage gain was in Nevada, at 21.5%. However, Nevada had net domestic migration gains only in 12 years, having experienced declines in the years immediately following the housing bust.
Florida had the largest net domestic migration numeric gain at 1,793,000, but like Nevada suffered two years of net domestic migration losses following the housing bust. Overall, 20 states have experienced net domestic migration gains over the period since 2000.
Two states, Minnesota and Massachusetts, have had 13 years of net domestic migration losses out of the last 14 years. Another nine states have had 14 years of net domestic migration losses out of 14. New York has suffered the largest loss, at 2,278,000 and the largest loss in percentage terms, 12.0%. California, also losing each of 14 years lost 1,739,000 net domestic migrants while Illinois lost 1,027,000 net domestic migrants in 14 years of losses. Others among the largest Northeastern states and Midwestern had 14 years of losses, including Ohio, Michigan and New Jersey. The exception was Pennsylvania, which had four years of net domestic migration gains.
| NET DOMESTIC MIGRATION: 2000-2015 | ||||||
| State/District | Years with Net Domestic Migration Gains: (Out of 14) | Rank | Net Domestic Migration: % of 2000 Population | Rank | Net Domestic Migration: Number | Rank |
| Arizona | 14 | 1 | 16.5% | 2 | 853,000 | 3 |
| South Carolina | 14 | 1 | 11.5% | 3 | 461,000 | 6 |
| North Carolina | 14 | 1 | 10.4% | 5 | 837,000 | 4 |
| Delaware | 14 | 1 | 8.0% | 8 | 63,000 | 19 |
| Oregon | 14 | 1 | 7.8% | 9 | 269,000 | 11 |
| Texas | 14 | 1 | 7.4% | 11 | 1,545,000 | 2 |
| Tennessee | 14 | 1 | 6.3% | 13 | 361,000 | 9 |
| Washington | 14 | 1 | 6.1% | 14 | 360,000 | 10 |
| Idaho | 13 | 9 | 10.0% | 6 | 130,000 | 13 |
| Georgia | 13 | 9 | 7.6% | 10 | 629,000 | 5 |
| Montana | 13 | 9 | 6.9% | 12 | 62,000 | 20 |
| Nevada | 12 | 12 | 21.5% | 1 | 433,000 | 7 |
| Florida | 12 | 12 | 11.2% | 4 | 1,793,000 | 1 |
| Colorado | 12 | 12 | 9.0% | 7 | 388,000 | 8 |
| South Dakota | 11 | 15 | 2.2% | 21 | 17,000 | 25 |
| Virginia | 11 | 15 | 2.0% | 23 | 142,000 | 12 |
| Wyoming | 10 | 17 | 5.3% | 16 | 26,000 | 23 |
| Oklahoma | 10 | 17 | 2.4% | 19 | 84,000 | 15 |
| Alabama | 10 | 17 | 2.0% | 24 | 89,000 | 14 |
| West Virginia | 10 | 17 | 0.5% | 26 | 8,000 | 26 |
| Arkansas | 9 | 21 | 2.7% | 18 | 72,000 | 16 |
| Maine | 9 | 21 | 2.1% | 22 | 26,000 | 23 |
| Kentucky | 9 | 21 | 1.6% | 25 | 65,000 | 18 |
| New Mexico | 8 | 24 | -1.0% | 28 | (19,000) | 30 |
| North Dakota | 7 | 25 | 5.3% | 15 | 34,000 | 21 |
| Utah | 7 | 25 | 3.0% | 17 | 67,000 | 17 |
| New Hampshire | 7 | 25 | 2.3% | 20 | 28,000 | 22 |
| Missouri | 7 | 25 | -0.2% | 27 | (10,000) | 28 |
| District of Columbia | 6 | 29 | -2.7% | 36 | (16,000) | 29 |
| Wisconsin | 4 | 30 | -1.1% | 30 | (60,000) | 35 |
| Vermont | 4 | 30 | -1.3% | 31 | (8,000) | 27 |
| Pennsylvania | 4 | 30 | -1.3% | 32 | (164,000) | 42 |
| Iowa | 4 | 30 | -1.9% | 34 | (57,000) | 34 |
| Maryland | 4 | 30 | -2.9% | 38 | (153,000) | 41 |
| Alaska | 4 | 30 | -4.9% | 42 | (31,000) | 31 |
| Louisiana | 4 | 30 | -7.3% | 48 | (326,000) | 45 |
| Indiana | 3 | 37 | -1.1% | 29 | (66,000) | 36 |
| Mississippi | 3 | 37 | -2.6% | 35 | (74,000) | 38 |
| Rhode Island | 3 | 37 | -6.6% | 46 | (70,000) | 37 |
| Hawaii | 2 | 40 | -3.9% | 39 | (47,000) | 32 |
| Minnesota | 1 | 41 | -1.6% | 33 | (79,000) | 39 |
| Massachusetts | 1 | 41 | -5.1% | 43 | (325,000) | 44 |
| Nebraska | 0 | 43 | -2.8% | 37 | (47,000) | 32 |
| Ohio | 0 | 43 | -4.5% | 40 | (507,000) | 46 |
| Kansas | 0 | 43 | -4.5% | 41 | (121,000) | 40 |
| California | 0 | 43 | -5.1% | 44 | (1,739,000) | 50 |
| Connecticut | 0 | 43 | -5.8% | 45 | (199,000) | 43 |
| Michigan | 0 | 43 | -7.1% | 47 | (711,000) | 47 |
| Illinois | 0 | 43 | -8.3% | 49 | (1,027,000) | 49 |
| New Jersey | 0 | 43 | -8.4% | 50 | (712,000) | 48 |
| New York | 0 | 43 | -12.0% | 51 | (2,278,000) | 51 |
| Derived from annual Census Bureau population estimates (No data for 2010) | ||||||
Restoration and then Some
Clearly the migration trends predominant in the years prior to the housing bubble and bust have reasserted themselves. It took more than a decade, and a World War to drag the United States out of the Great Depression and eventually to far greater prosperity. It has taken almost that long to accomplish the same thing following the Great Recession, though thankfully without a world war. If a mild recovery has sparked a reversion to the historic norm, it would be fascinating to see what would happen under boom conditions.
Wendell Cox is Chair, Housing Affordability and Municipal Policy for the Frontier Centre for Public Policy (Canada), is a Senior Fellow of the Center for Opportunity Urbanism (US), a member of the Board of Advisors of the Center for Demographics and Policy at Chapman University (California) and principal of Demographia, an international public policy and demographics firm. He is co-author of the "Demographia International Housing Affordability Survey" and author of "Demographia World Urban Areas" and "War on the Dream: How Anti-Sprawl Policy Threatens the Quality of Life." He was appointed to three terms on the Los Angeles County Transportation Commission, where he served with the leading city and county leadership as the only non-elected member. He served as a visiting professor at the Conservatoire National des Arts et Metiers, a national university in Paris.
Photo: Florida Oranges by University of Florida IFAS


