
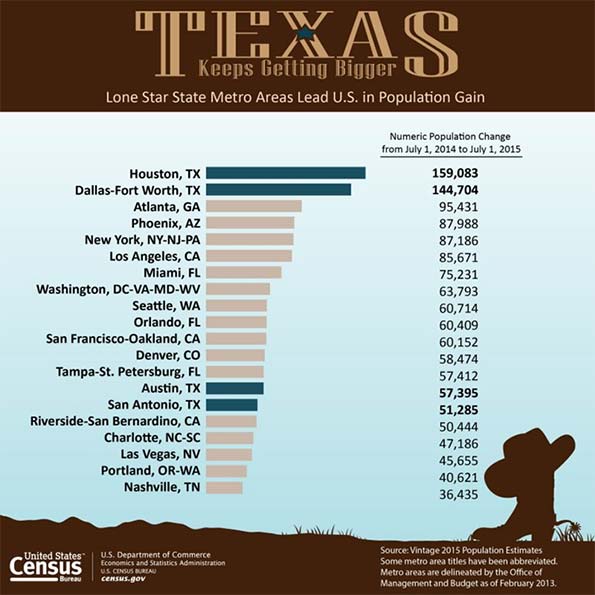
The United States Census Bureau has just released its 2015 population estimates for metropolitan areas and counties. Again, the story is Texas, with the Bureau’s news release headline reading: Four Texas Metro Areas Collectively Add More Than 400,000 People in the Last Year. The Census Bureau heralded the accomplishment with a ”Texas Keeps Getting Bigger” poster, which is shown below. The detailed data is in the table at the bottom of the article.
Fastest Growing
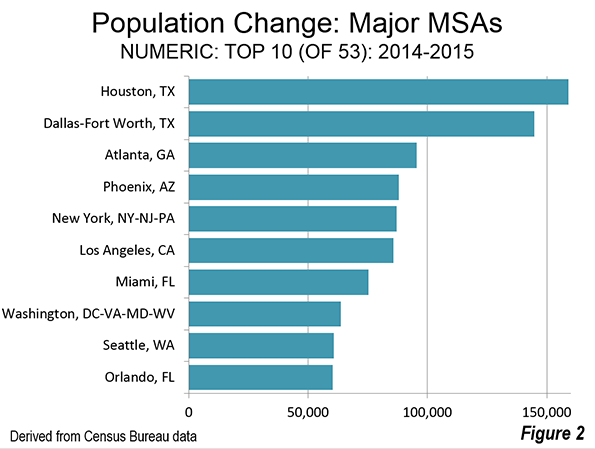
Texas has four of the nation’s major metropolitan areas (over 1,000,000 population), and all of them ranked in the top 20 (out of 53) in population gain between 2014 and 2015. Houston again was number one, with a gain of 159,000, Dallas-Fort Worth followed in second place, gaining 145,000. The gap between Dallas-Fort Worth and Houston was small, only 10 percent. However, the gap between the third largest city (Atlanta) and Dallas-Fort Worth was more than 50 percent
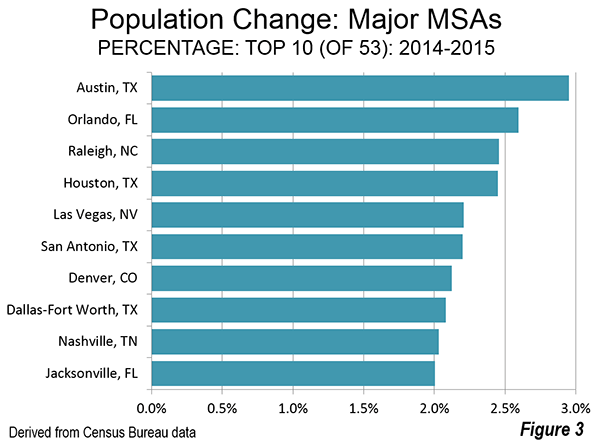
Austin and San Antonio were also in the top 20. Austin gained 57,000 residents, and again was the fastest growing major metropolitan area in the nation (3.0 percent). San Antonio added 51,000.
This represents something of a return to pre-Great Recession normalcy, with Atlanta adding the third most population (95,000) and Phoenix adding 88,000. These two metropolitan areas were hard hit in the housing bust, but are seeing a return of substantial growth. New York, which is far larger than any of the top four, took fifth place, adding 87,000 (Figure 2).
On a percentage gain basis, all four Texas metropolitan areas were in the top 10. Austin was again the fastest growing. Houston was 4th, San Antonio 6th and Dallas-Fort Worth 8th. Two other of the national best performers in percentage population growth were also high on the list, including #3 Raleigh and #5 Las Vegas. Las Vegas was the fastest growing major metropolitan area through most of the 2000s. When Las Vegas stumbled late in the 2000s, Raleigh assumed the top position. Denver ranked 7th, the only non-southern metropolitan area in the top 10 (Figure 3).
Slowest Growing (or Losing)
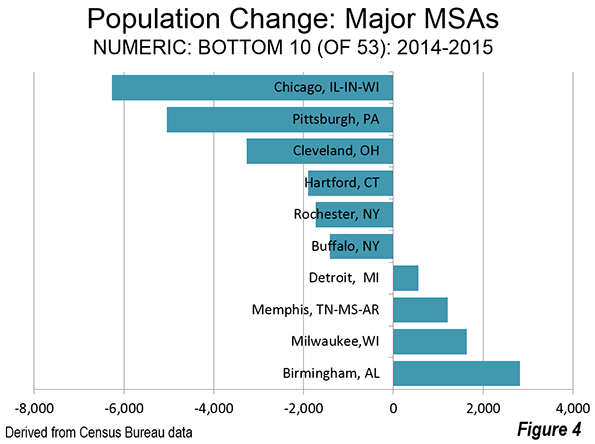
The Chicago metropolitan area had the largest population loss, at 6,000. This was the second straight year of losses for Chicago, though last year’s was much smaller. Chicago, at 9.55 million residents will need to reverse this performance if it is ever to add the 450,000 people necessary to make it a megacity of over 10 million. Chicago’s weather is not the most inviting and the state of Illinois’ dismal fiscal position (rated by one source as the second worst run in the nation) is not likely to attract the job creating investment necessary to population growth.
Five other metropolitan areas experienced losses, including Pittsburgh, Cleveland, Hartford, Rochester and Buffalo. Not all of the South is growing either with both Memphis and Birmingham residing in the bottom 10 (Figure 4).
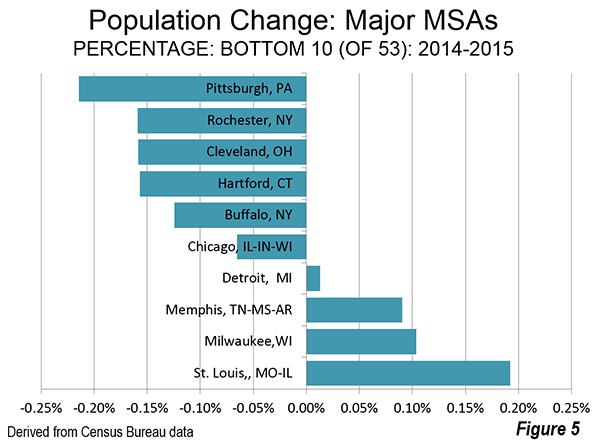
Pittsburgh lost the largest percentage of its population, followed by Rochester, Cleveland, Hartford, Buffalo and Chicago (Figure 5).
Domestic Migration: Top 10
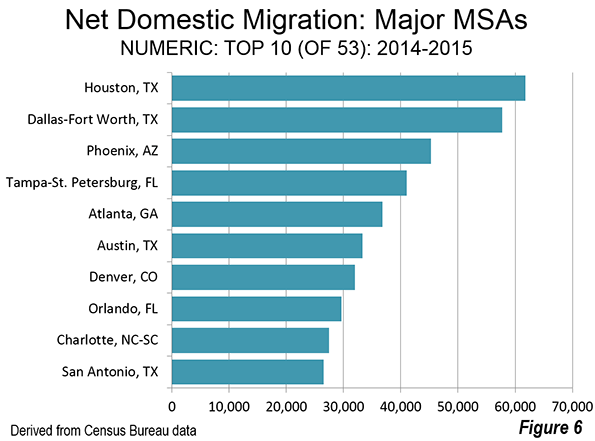
The four Texas cities all showed up on the top 10 in numeric net domestic migration gain as well. Houston added 62,000 net domestic migrants, followed by Dallas-Fort Worth and 58,000. Phoenix ranked third, Tampa St. Petersburg ranked fourth and Atlanta ranked fifth. Austin was sixth in net domestic migration and the other Texas City, San Antonio, ranked 10th (Figure 6).
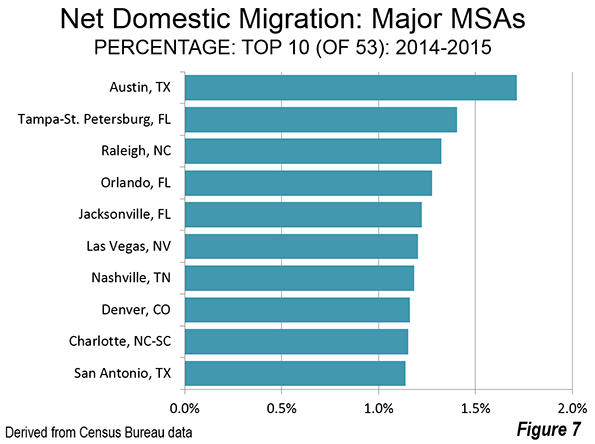
Austin led the nation in the percentage of population growth from net domestic migration, at approximately 1.7 percent. Tampa St. Petersburg ranked second, followed by Raleigh, Orlando and Jacksonville (Figure 7).
Domestic Migration: Bottom 10
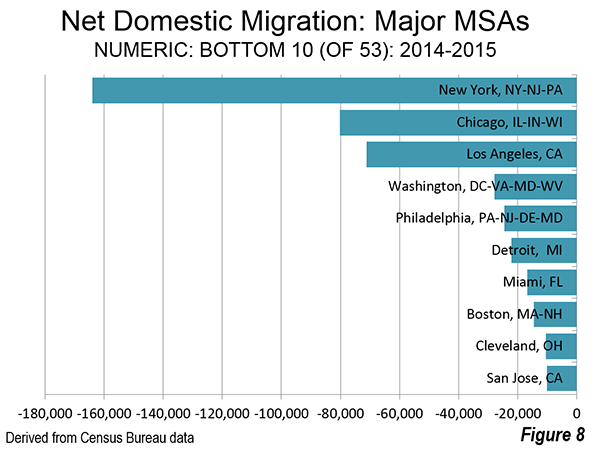
By far the largest net domestic migration loser was New York, which lost 164,000. Chicago lost 80,000, and Los Angeles lost 71,000. It was a substantial drop to the fourth largest loser, Washington at 28,000, closely followed by Philadelphia at 24,000 and Detroit at 22,000 (Figure 8).
Chicago had the largest percentage loss of any major metropolitan area from net domestic migration, at 0.83 percent, slightly more than New York's 0.82 percent. Hartford, Rochester and Memphis ranks from 3rd to 5th, all losing 0.6 percent from net domestic migration or more. Milwaukee, Los Angeles, Virginia Beach, San Jose, Detroit and Cleveland all lost between 0.5 percent and 0.6 percent to net domestic migration (Figure 9).

Ranking Changes
There were a few changes in the rankings this year. Washington passed Philadelphia to assume the sixth largest position. Philadelphia, which was the fourth largest metropolitan area in the nation in the early 2000's has fallen to seventh, having also been passed by both Dallas-Fort Worth and Houston. Denver overtook St. Louis, to assume the 19th position. Orlando passed both San Antonio and Pittsburgh to become the 24th largest metropolitan area. Even while falling behind Orlando, San Antonio past Pittsburgh. Las Vegas overtook Kansas City and became the 29th largest metropolitan area. Austin passed both Indianapolis and San Jose.
Milestones were also set by Miami, which rose to above 6 million population, while Columbus and Austin grew to more than 2 million. Perhaps the bigger surprise was a milestone not reached. Had recent trends continued, Honolulu would have become the 54th metropolitan area to reach 1 million population. However, Honolulu fell short by 1300 residents.
Return to the City: The Elusive Illusion
Despite the popular lore one hears at a Starbucks in Manhattan or reads in some ever-hopeful core city-centric news outlets, people are still moving to the suburbs. There is no doubt that urban cores, especially close to downtown areas (central business districts) are doing better than before, in no small measure because crime rates have fallen so much (Thank you, Rudi Giuliani).
In all, 22 core counties out of 53 added net domestic migrants. But only y seven added more domestic migrants than the corresponding suburbs. Of these, only one is dominated by high density urbanization, the District of Columbia (Washington). Another, New Orleans, continues its recovery from the huge hurricane population losses. The other five core counties are functionally more suburban than urban (Phoenix, Raleigh, Richmond, Sacramento and San Antonio).
But, overall, domestic migration continues from the core cities to the suburbs. That has been the case even in the worst year for suburban growth (2010-2011) and continued in 2014-2015. Core counties last year lost a net 185,000 domestic migrants, while the suburban counties gained 187,000.
Conclusion
With the release of 2015 population estimate data, halfway between the 2010 and 2010 census, the nation is settling back into a pattern of suburban southern and western growth.
| Major Metropolitan Area Population Estimates: 2015 | |||||||
| Population | 2014-2015 | ||||||
| Rank | Metropolitan Area | 2010 | 2014 | 2015 | % Change 2014-2015 | Net Domestic Migration | Rank: Domestic Migration |
| 1 | New York, NY-NJ-PA | 19,601 | 20,095 | 20,182 | 0.43% | -0.82% | 52 |
| 2 | Los Angeles, CA | 12,844 | 13,254 | 13,340 | 0.65% | -0.54% | 47 |
| 3 | Chicago, IL-IN-WI | 9,471 | 9,557 | 9,551 | -0.07% | -0.84% | 53 |
| 4 | Dallas-Fort Worth, TX | 6,453 | 6,958 | 7,103 | 2.08% | 0.83% | 14 |
| 5 | Houston, TX | 5,948 | 6,498 | 6,657 | 2.45% | 0.95% | 12 |
| 6 | Washington, DC-VA-MD-WV | 5,667 | 6,034 | 6,098 | 1.06% | -0.46% | 42 |
| 7 | Philadelphia, PA-NJ-DE-MD | 5,971 | 6,054 | 6,070 | 0.27% | -0.40% | 40 |
| 8 | Miami, FL | 5,586 | 5,937 | 6,012 | 1.27% | -0.28% | 36 |
| 9 | Atlanta, GA | 5,304 | 5,615 | 5,711 | 1.70% | 0.66% | 16 |
| 10 | Boston, MA-NH | 4,565 | 4,739 | 4,774 | 0.74% | -0.31% | 38 |
| 11 | San Francisco-Oakland, CA | 4,345 | 4,596 | 4,656 | 1.31% | 0.19% | 22 |
| 12 | Phoenix, AZ | 4,205 | 4,487 | 4,575 | 1.96% | 1.01% | 11 |
| 13 | Riverside-San Bernardino, CA | 4,244 | 4,439 | 4,489 | 1.14% | 0.16% | 23 |
| 14 | Detroit, MI | 4,291 | 4,301 | 4,302 | 0.01% | -0.51% | 44 |
| 15 | Seattle, WA | 3,449 | 3,673 | 3,734 | 1.65% | 0.43% | 17 |
| 16 | Minneapolis-St. Paul, MN-WI | 3,356 | 3,496 | 3,525 | 0.83% | -0.23% | 32 |
| 17 | San Diego, CA | 3,104 | 3,266 | 3,300 | 1.04% | -0.29% | 37 |
| 18 | Tampa-St. Petersburg, FL | 2,789 | 2,918 | 2,975 | 1.97% | 1.41% | 2 |
| 19 | Denver, CO | 2,554 | 2,756 | 2,814 | 2.12% | 1.16% | 8 |
| 20 | St. Louis,, MO-IL | 2,790 | 2,806 | 2,812 | 0.19% | -0.27% | 33 |
| 21 | Baltimore, MD | 2,716 | 2,787 | 2,797 | 0.38% | -0.31% | 39 |
| 22 | Charlotte, NC-SC | 2,224 | 2,379 | 2,426 | 1.98% | 1.15% | 9 |
| 23 | Portland, OR-WA | 2,232 | 2,349 | 2,389 | 1.73% | 0.91% | 13 |
| 24 | Orlando, FL | 2,140 | 2,327 | 2,387 | 2.60% | 1.28% | 4 |
| 25 | San Antonio, TX | 2,153 | 2,333 | 2,384 | 2.20% | 1.14% | 10 |
| 26 | Pittsburgh, PA | 2,357 | 2,358 | 2,353 | -0.21% | -0.28% | 35 |
| 27 | Sacramento, CA | 2,155 | 2,245 | 2,274 | 1.31% | 0.41% | 18 |
| 28 | Cincinnati, OH-KY-IN | 2,118 | 2,148 | 2,158 | 0.43% | -0.12% | 31 |
| 29 | Las Vegas, NV | 1,953 | 2,069 | 2,115 | 2.21% | 1.20% | 6 |
| 30 | Kansas City, MO-KS | 2,014 | 2,071 | 2,087 | 0.78% | 0.04% | 26 |
| 31 | Cleveland, OH | 2,076 | 2,064 | 2,061 | -0.16% | -0.51% | 43 |
| 32 | Columbus, OH | 1,906 | 1,997 | 2,022 | 1.22% | 0.26% | 19 |
| 33 | Austin, TX | 1,728 | 1,943 | 2,001 | 2.95% | 1.71% | 1 |
| 34 | Indianapolis. IN | 1,893 | 1,972 | 1,989 | 0.86% | 0.05% | 25 |
| 35 | San Jose, CA | 1,842 | 1,954 | 1,977 | 1.15% | -0.52% | 45 |
| 36 | Nashville, TN | 1,676 | 1,794 | 1,830 | 2.03% | 1.18% | 7 |
| 37 | Virginia Beach-Norfolk, VA-NC | 1,680 | 1,718 | 1,725 | 0.41% | -0.52% | 46 |
| 38 | Providence, RI-MA | 1,602 | 1,610 | 1,613 | 0.22% | -0.28% | 34 |
| 39 | Milwaukee,WI | 1,557 | 1,574 | 1,576 | 0.10% | -0.54% | 48 |
| 40 | Jacksonville, FL | 1,349 | 1,421 | 1,449 | 2.00% | 1.22% | 5 |
| 41 | Oklahoma City, OK | 1,258 | 1,338 | 1,358 | 1.56% | 0.66% | 15 |
| 42 | Memphis, TN-MS-AR | 1,326 | 1,343 | 1,344 | 0.09% | -0.60% | 49 |
| 43 | Louisville, KY-IN | 1,238 | 1,271 | 1,278 | 0.57% | 0.02% | 28 |
| 44 | Raleigh, NC | 1,137 | 1,243 | 1,274 | 2.46% | 1.32% | 3 |
| 45 | Richmond, VA | 1,210 | 1,260 | 1,271 | 0.92% | 0.19% | 21 |
| 46 | New Orleans. LA | 1,196 | 1,252 | 1,263 | 0.87% | 0.19% | 20 |
| 47 | Hartford, CT | 1,214 | 1,213 | 1,211 | -0.16% | -0.74% | 51 |
| 48 | Salt Lake City, UT | 1,092 | 1,155 | 1,170 | 1.36% | -0.04% | 29 |
| 49 | Birmingham, AL | 1,129 | 1,143 | 1,146 | 0.25% | -0.09% | 30 |
| 50 | Buffalo, NY | 1,136 | 1,137 | 1,135 | -0.12% | -0.46% | 41 |
| 51 | Rochester, NY | 1,080 | 1,084 | 1,082 | -0.16% | -0.70% | 50 |
| 52 | Grand Rapids, MI | 990 | 1,029 | 1,039 | 0.94% | 0.09% | 24 |
| 53 | Tucson, AZ | 982 | 1,004 | 1,010 | 0.58% | 0.02% | 27 |
| Total | 170,895 | 178,063 | 179,875 | 1.02% | -0.52% | ||
| In 000s | |||||||
| Data from Census Bureau | |||||||
Wendell Cox is principal of Demographia, an international pubilc policy and demographics firm. He is a Senior Fellow of the Center for Opportunity Urbanism (US), Senior Fellow for Housing Affordability and Municipal Policy for the Frontier Centre for Public Policy (Canada), and a member of the Board of Advisors of the Center for Demographics and Policy at Chapman University (California). He is co-author of the "Demographia International Housing Affordability Survey" and author of "Demographia World Urban Areas" and "War on the Dream: How Anti-Sprawl Policy Threatens the Quality of Life." He was appointed to three terms on the Los Angeles County Transportation Commission, where he served with the leading city and county leadership as the only non-elected member. He served as a visiting professor at the Conservatoire National des Arts et Metiers, a national university in Paris.
Cover picture: Census Bureau ”Texas Keeps Getting Bigger” poster (poster is used at the top and also as the first figure)


