
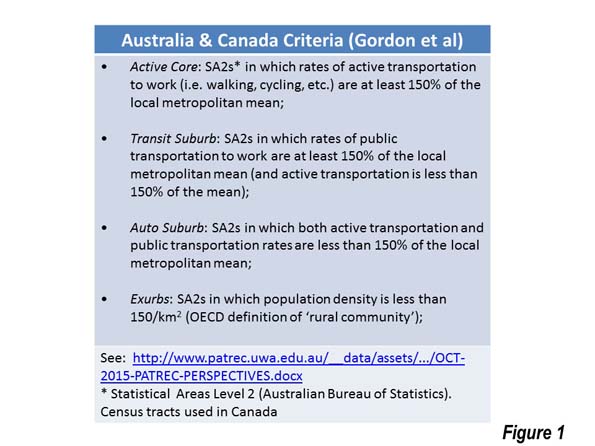
Professors David L. A. Gordon of Queens University (Canada) and Paul Maginn and Sharon Biermann of the University of Western Australia have now shown Australia to be a largely suburban nation. This follows on Professor Gordon’s work with colleagues in 2013 that came to the same conclusion on Canada based upon 2006 census data. By using census tract data, rather than municipality data, Gordon, et al were able to avoid the misleading but readily accessible jurisdictional analysis (central city versus suburbs) that equated large low-density central municipalities like Calgary and Edmonton, with more compact and dense municipalities like Vancouver and Montreal (or New York with Phoenix). The Gordon, et al criteria is illustrated in Figure 1.
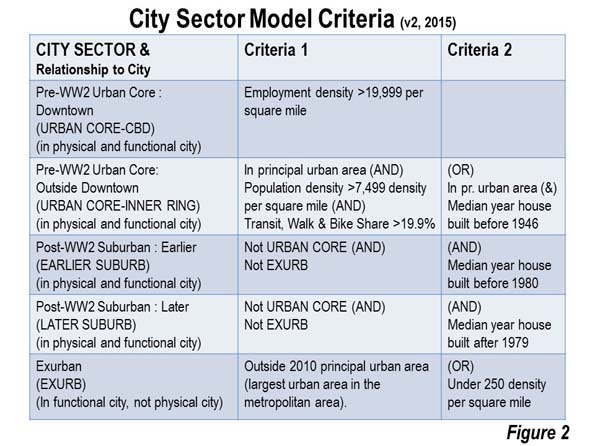
Broadly following the Gordon et al research, in the Spring of 2014, I published a similar “City Sector Model” using postal code tabulation areas (zip codes) for the major metropolitan areas of the United States. That criteria is illustrated in Figure 2.
This article compares the Gordon findings in Canada and Australia and contrasts them with my findings in the United States.
The Gordon Research: Canada and Australia
In Australia, as in Canada, Professors Gordon, Maginn and Biermann divided metropolitan areas into four classifications at a small area level. The research called the urban core classification "active core," to note the greater dependence of residents on walking and cycling for commuting to work. They divided suburban areas into transit and auto suburban areas, and designated the more rural areas of metropolitan areas as exurban. In both countries, they used the functional or economic definition of cities, which is metropolitan areas or labor market areas (Note 1).
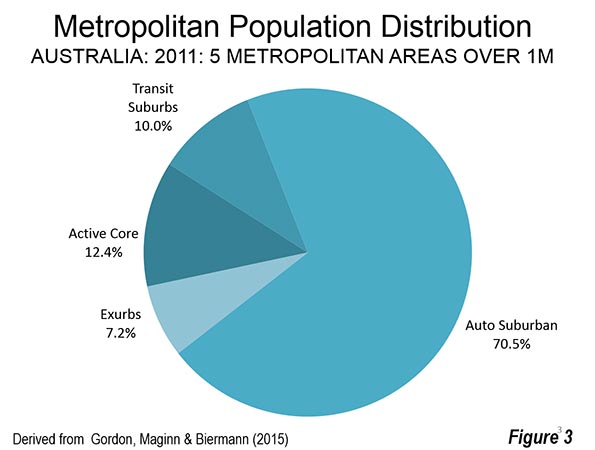
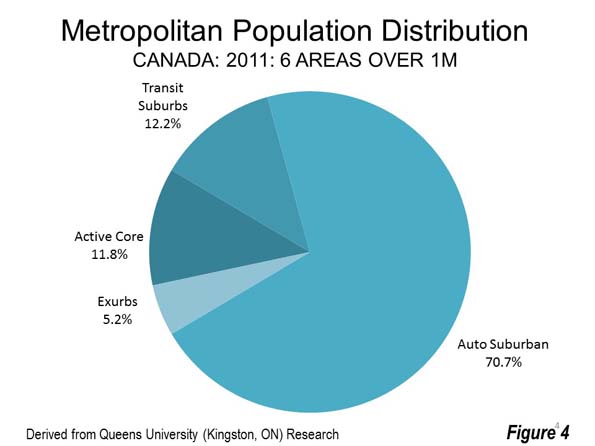
Gordon, Maginn and Biermann’s analysis shows that Australia’s 27 metropolitan areas are 13 percent “active core”, nine percent transit suburbs, 69 percent auto suburbs and 10 percent exurban. This is nearly the same as the previous research on the 2011 Census of Canada which revealed 12 percent active core, 11 percent transit suburbs, 69 percent auto suburbs and eight percent exurban for all 33 metropolitan areas.
The Major Metropolitan Areas (Over 1,000,000 Population) In the smaller number of Australian metropolitan areas with more than 1,000,000 population, the “active cores” are only slightly larger than those in Canada (12.4 percent of the metropolitan population versus 11.8 percent). But Canada’s major metropolitan areas has larger “transit suburbs” by a 12.2 percent to 10.0 percent margin. The “auto suburban” figures are virtually the same, with Australia at 70.5 percent and Canada at 70.7 percent. Finally, Australia has a slightly larger “exurbs,” at 7.2 percent compared to Canada’s 5.2 percent (Figures 3 and 4).
Comparing to the United States
In the United States, the City Sector Model uses somewhat different criteria. Gordon’s central classifications (“active core” and “transit suburb”) parallel the City Sector Model’s “urban core: CBD” and “urban core: inner ring.” Gordon’s “auto suburban” and “exurban” also roughly parallel the two “suburban” and the exurban City Sector Model classifications.
Perhaps the largest difference between the two models is in the treatment of commuting. Professor Gordon’s approach is to classify the two central areas based on 50 percent higher than each metropolitan’s area average shares of walking, cycling and transit journey to work travel. The City Sector Model uses an across-the-board minimum 20 percent market share (transit, cycling and walking combined), to replicate a division between more dense pre-World War II development and the automobile oriented suburbs that followed.
Comparing to the United States
Of course, it is to be expected that the United States, with the lowest density built-up urban areas (called population centers in Canada and urban centres in Australia) would be even more suburban than Australia and Canada . This is indicated by the data (see Demographia World Urban Areas).
There are large differences in the two more central classifications. In Australia, the two central areas have 22.4 percent of the metropolitan area population, somewhat less than Canada’s 24.0 percent. In the United States the two central areas have a smaller 14.8 percent of the metropolitan area population (Figure 5).
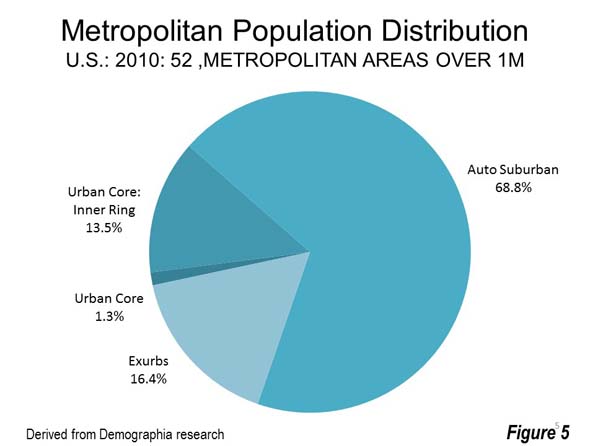
Various factors account for this difference. There were, for example, huge urban core population losses in the United States, but not in Canada and Australia. Another cause is the much earlier motorization of the United States, which by 1929, according to economist Robert Gordon, had achieved 0.9 vehicles per household and had 90 percent of the world’s registered vehicles (Note 2). With this unparalleled market penetration, the U.S. had a several decade long head start in automobile oriented suburbanization. Canada equaled the 1929 U.S. automobile market penetration in the middle 1950s and Australia in the middle 1960s.However, in the suburban classification, the metropolitan areas of the three nations were very similar. The US automobile suburb share of the population, at 68.8 percent was within two percentage points of both Canada and Australia. However, like the urban core, the suburbs showed considerably different results, with the United States having a 16.4 percentage exurban share, compared to approximately 10 percentage point lower shares in both Canada and Australia.
Part of difference in the exurbs is the larger geographic size of U.S. metropolitan areas, which are far less representative in capturing the genuine labor market. The building geographical blocks used by the U.S. Office of Management and Budget are simply too large for sufficient preciseness. This is illustrated by the Riverside-San Bernardino metropolitan area, which covers an area about the same size as the Canadian province of New Brunswick or the Australian state of Tasmania. By contrast, in Canada, Statistics Canada uses municipalities to construct metropolitan areas, while Australia uses “Statistical Areas Level 4,” which are generally smaller than US counties (Note 3). When the boundaries of a metropolitan area are far larger than the actual commuting shed (as often happens in the United States), more people will be in the metropolitan area.
At the same time, these results must be interpreted carefully, since there are differences in the criteria and geographical building blocks of metropolitan areas in all three nations.
Comparison of Population Growth
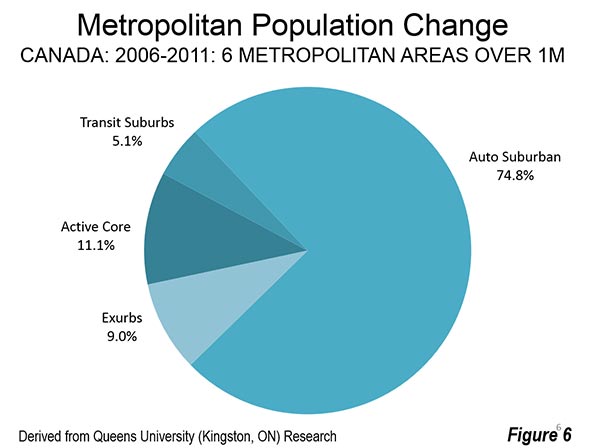
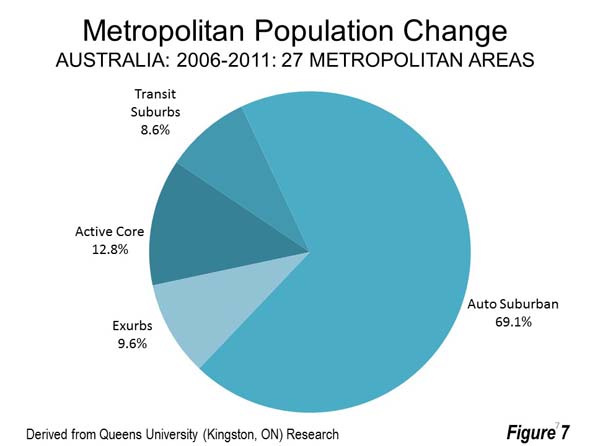
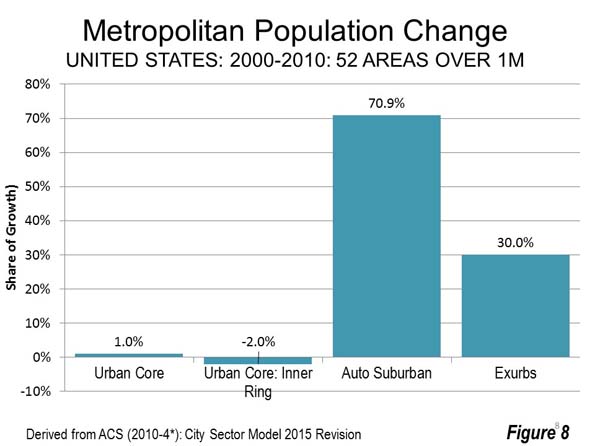
Professor Gordon’s research in both nations shows suburban growth far out stripping growth in the central areas. In Canada, nearly 84 percent of major metropolitan area population growth between 2006 and 2011 was in the “auto suburbs” and “exurbs” (Figure 6). In Australia (27 metropolitan areas), the “auto suburbs” and “exurbs accounted” for nearly 78 percent of population growth (Figure 7). In the United States, the suburbs and exurbs accounted for over 85 percent (Figure 8).
Suburban World
Contrary to planning preference for dense urbanization, suburbanization has occurred virtually wherever people can afford cars. This is even true in Europe, Japan and China. For example, the municipality of Paris continues to languish with a population a quarter below its level of 135 years ago (1881). The 8 million resident urban area growth since that time has been in the suburbs , which now cover more than 25 times the area of the ville de Paris (the central municipality). Other examples, such as the core municipalities of Copenhagen (from 1950), Barcelona and Milan (from 1970) have suffered significant population losses while all metropolitan area growth has been in the suburbs. There are many similar examples around the world.
Even with the differing definitions, the data in Canada, Australia and the United States is remarkably similar. Of course, not all suburbs are the same, but it should not be surprising that the organic growth of cities continues on their edges.
Note 1: For further information see: Paul Cheshire, Max Nathan and Henry G. Overman of the London School of Economics in their recent book, Urban Economics and Urban Policy: Challenging Conventional Policy Wisdom.
Note 2: See Robert J. Gordon, The Rise and Fall of American Growth: The U.S. Standard of Living Since the Civil War, page 374, reviewed at http://www.newgeography.com/content/005364-robert-gordons-notable-history-economics-and-living-standards.
Note 3: The larger size of US exurbs is illustrated by the 11,400 square kilometer average areas outside the principal urban areas (exurbs) of US metropolitan areas. In Australia, the average outside the principal urban centres is 6,500 square kilometers, while in Canada the average area outside the principal population centres is 4,600 square kilometers (data based on metropolitan areas with more than 1,000,000 population).
Wendell Cox is principal of Demographia, an international public policy and demographics firm. He is a Senior Fellow of the Center for Opportunity Urbanism (US), Senior Fellow for Housing Affordability and Municipal Policy for the Frontier Centre for Public Policy (Canada), and a member of the Board of Advisors of the Center for Demographics and Policy at Chapman University (California). He is co-author of the "Demographia International Housing Affordability Survey" and author of "Demographia World Urban Areas" and "War on the Dream: How Anti-Sprawl Policy Threatens the Quality of Life." He was appointed to three terms on the Los Angeles County Transportation Commission, where he served with the leading city and county leadership as the only non-elected member. He served as a visiting professor at the Conservatoire National des Arts et Metiers, a national university in Paris.
Photo: Brisbane, Australia Inner Suburbs (by author)


