.jpg")
The presidential election of 2016 occurred at the crest of a national debate over economic inequality, deeply researched by economists and sociologists since the 1990s, widely perceived to have risen sharply since the 1970s, and a focus of the first serious left-wing insurgency the Democratic Party in four decades, that of Bernie Sanders. Can class and inequality help explain the election result? The answer appears to be that they can, quite strongly, but in ways that may seem surprising.
After Donald Trump's unexpected victory, Hillary Clinton notably blamed Vladimir Putin, Julian Assange and James Comey. Clinton-friendly commentators fumed against sexism, racism and the other prejudices of the white working class. A book entitled “Shattered” by two journalists put the onus on the data-driven ineptitude of Clinton's campaign team. The legal analyst Jeffrey Toobin called attention to vote suppression (through voter ID laws and by other means) especially in Wisconsin and Michigan, and an analysis of turnout by race, conducted by three political science professors and an analyst at Demos, confirmed that had the 2012 black turnout prevailed in 2016, Clinton rather than Trump would have been elected.
The election was so close that any of these arguments might be considered valid, up to a point. Even so, simple calculations can put some of them into perspective. For instance, a study showed that about nine percent of Obama's 2012 voters went over to Trump. If that is correct, then considerably less than five percent of all voters moved from Obama to Trump, when one considers new voters and those who were no longer voting in 2016, while about half that proportion went from Romney to Clinton. Another study of voter attitudes in 2016 found no reason even to measure the effect of late-breaking news on vote-switching from Obama to Trump, as opposed to the economy, immigration, “Muslims,” misogyny or perhaps simple dislike of Hillary Clinton.
Still, such a verdict begs two important questions: Why was the election so close in the first place? And, did economic inequality have anything to do with the outcome?
To address these issues, two facts need to be borne in mind. First, rising economic inequality is subject to common forces across the entire land-mass and population of the country. It's a national phenomenon, as most people perceive and measure it. But American presidential elections are resolved through winner-take-all in the Electoral College, a constitutional confection of the states. So what happens at the national level in the economy is expressed – if at all – in politics at the level of the state. So to find meaning in this relationship, we need to find a connection between levels or movement of inequalities and the election outcome at the level of the individual states.
Coefficients of economic inequality across households within states have been available from the Bureau of Economic Analysis on an annual basis only since 2000. Before that, sample sizes in the Current Population Survey made measuring inequality in small states problematic, since a state with population of (say) half a million might have as few as one hundred households represented in a national sample survey of 60,000 families. So data at the required level of detail were available only from the decennial census. This raised an issue of comparative measurement through time, especially since election years coincide with census years only once every two decades.
To deal with this issue, Travis Hale and I used the detailed annual measures of the Employment and Earnings database of the Bureau of Labor Statistics to construct annual measures of pay inequality that could be calibrated to the Census measures of income inequality, and we showed that these measures generate reliable annual estimates of state-level income inequality back to 1969. In recent weeks Jaehee Choi has extended Hale's measures by a decade to 2014, giving us an uninterrupted panel matrix of 2295 inequality measures for 51 states (including DC) over 45 years.
There are two ways to look at this data. One is to compare election outcomes to the current level of inequality in each state, and to ask: did the more egalitarian states have a tendency to choose one candidate over the other? The other approach, accessible only through a data set of the type just described, is to look at changes in inequality over time, and to ask, did states where inequality grew more have a tendency to choose one candidate over the other? Economists are especially drawn to the second approach, because it washes out (“controls for”) differences in the level of inequality across states that may be due to some timeless historical factors. For instance, a state with large cities and wealthy industries (such as international banking) is likely to have a baseline of inequality quite different from a wheat- or corn-growing state on the Great Plains.
In this case, both approaches generate a similar, striking result. A simple correlation between the level of inequality in each state and the vote share of one candidate in that state is 0.60. And the correlation between inequality changes and vote share is even higher: about 0.69 for the case of the changes from 1990 to 2014; depending on base year chosen the correlation fluctuates up to a maximum of about 0.71. This means that a large share of the election outcome across the states can be explained solely by the relative degree of rising inequality within each state over a quarter-century, give or take.
A somewhat surprising result
Using our measure of pay inequality, which avoids any distortion associated with making a conversion to income inequality measures, the fourteen states with the largest increases in inequality after 1990 without exception voted for Hillary Clinton.1 These fourteen included almost all of the large states that Clinton carried, including California, New York, New Jersey, Massachusetts, Virginia and Illinois. The largest Clinton state below the top fourteen is Washington, and after that, Minnesota (which she carried by whisker); the others include Vermont and Delaware, small states embedded in regions (New England, the Mid-Atlantic) where the increase of inequality was much larger than it was in the states themselves. Vermont is not immune from economic change in New York or Massachusetts, nor is Delaware unaffected by events in New Jersey or Maryland.
Conversely, the seven states with the smallest increase in inequality, and ten of the lowest twelve, all voted for Donald Trump. These included Wyoming, West Virginia, Oklahoma, Utah, North Dakota, Montana, Alaska, Indiana, Nebraska and Kentucky, as well as the critical Obama-to-Trump states of Ohio and Michigan. In the middle range, we find a series of states that were (or, in the case of Georgia, might have been) competitive including Wisconsin and Pennsylvania, Florida, and North Carolina.
The correspondence of inequality-change to the election outcome is almost uncanny.
A plausible explanation emerges with a moment's thought. Clinton-majority states are characterized by high-income enclaves of finance, technology, insurance and government contracts, which often exist alongside large low-income minority and immigrant communities, sufficiently separated by geography and political boundary lines to be almost autonomous from each other. Both of these communities vote Democratic, yet out of highly differing political and social interests; the former perhaps most of all for reasons of social liberalism and environmentalism; the latter out of economic interest and historical alliances on civil rights and immigration. Where they together predominate, Democrats prevail.
Trump-majority states are largely middle class, and in the swing states they have industrial communities that once employed unionized black workers but have been for decades in decline increasing the relative weight of the rural, conservative and white. Where (as in the South, but also Wisconsin, Michigan and Ohio) these states are racially polarized, election manipulation and vote suppression may have accelerated the political and demographic trend. The shift to Trump, in this analysis, occurred in those states left behind by the takeover of the commanding heights of the national economy by finance and technology, and the shift away from manufacturing.
Meanwhile, across the South, a parallel shift is underway in the opposite direction – in Georgia, Arizona, North Carolina, and Texas. This shift is incomplete, and it is not yet very far advanced. But it leans toward a new coalition of pro-trade business elites, an increasing socially-liberal professional class, and an expanding minority vote, strongly buttressed by the immigrant Hispanic community. While attention in the 2016 election focused on the states that defected to Trump, three of these states moved noticeably in Clinton's direction, relative to where they had been in 2012.
To the extent that this analysis can help foretell the future, the fate of the Democratic Party hangs on a strategic choice. Democrats can seek to recapture the decayed industrial states they lost last year, but might regain with a more populist program. That will be the Sanders strategy in 2020, and it will surely be the strategy of any populist competitor. If Trump falls flat and his working class supporters are disaffected in four years, this may be the quick road back to the White House. But it may fall short, because the Democratic base in those states is eroding, and the challenge of mobilizing sufficient voters to overcome a growing demographic disadvantage will deepen as the years pass.
The other choice, is for the Democrats to ride the demographic drift in the South and Southwest, where inequality is likely to rise as the post-industrial economy shifts there. In that case, they can hope to make up for mid-western losses without dramatic change in the political orientation inherited from the Clintons. The party would then eventually return to electoral predominance on an arc of states running south from Virginia and east from southern California.
The problem with this strategy is that it will not work in the near term, because it will require a shift in the linchpin state of Texas, which gave Clinton just 43.2 percent of her vote. This was a distinct improvement over 2012, and came with a Democratic sweep in Harris County, the nation’s third largest. But it’s too early to say it foretells a statewide tipping point in 2020, and perhaps not even in 2024. And the dilemma is that the alternative, a move to full-throated populism– perhaps the only reasonable strategy for 2020 – could poison the well in the South and Southwest for later years.
There are, of course, many reasons to be cautious about placing too much weight on any single variable; the political science literature has seen a fair number of forecasting models come and go. Still, the relationship of inequality change to election outcomes seems strong, and rooted in a certain amount of political common sense. And it has the appeal of paradox: as each party achieves its stated agenda, the political fortunes of the other party improve.
Of course, we have already seen that Republicans have no real interest in delivering their promised manufacturing revival. Sadly, a similar logic holds on the Democratic side. Given even a slight hope that Hillary Clinton's political strategy was not wrong but premature, there is little doubt that the powerful forces behind the Democrats will opt for a perpetual coalition based on grotesque inequalities, and on the fostering of false hopes among the brown and the black.
Figure: Changing Inequality 1990-2014 and the Clinton vote share, 2016, by state 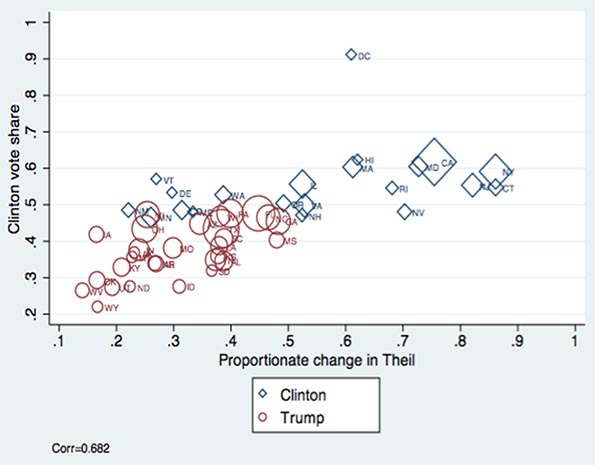
Each state is weighted by its electoral votes. Calculations by Jaehee Choi and James Galbraith.
| Change in Inequality 1990-2014 and the Election Outcome, 2016, by State. | |||
| State | Change in Pay Inequality 1990 to 2014 (Theil measure), Index Number, 1990 =100 | Trump / Clinton | Clinton Percentage |
| Connecticut | 186.4 | C | 54.6% |
| New York | 179.6 | C | 59.0% |
| New Jersey | 176.7 | C | 55.5% |
| California | 172.7 | C | 61.7% |
| Rhode Island | 169.4 | C | 54.4% |
| Maryland | 168.8 | C | 60.3% |
| Nevada | 167.6 | C | 47.9% |
| Hawaii | 161.3 | C | 62.2% |
| Massachusetts | 160.7 | C | 60.0% |
| District of Columbia | 159.4 | C | 90.9% |
| Illinois | 149.8 | C | 55.8% |
| Virginia | 149.1 | C | 49.8% |
| Oregon | 148.1 | C | 50.1% |
| New Hampshire | 147.5 | C | 46.8% |
| Georgia | 146.7 | T | 45.9% |
| Mississippi | 146.7 | T | 40.1% |
| North Carolina | 144.2 | T | 46.2% |
| Florida | 141.4 | T | 47.8% |
| Washington | 139.3 | C | 51.8% |
| Pennsylvania | 138.8 | T | 47.9% |
| Louisiana | 138.7 | T | 38.4% |
| Wisconsin | 138.5 | T | 46.5% |
| Kansas | 138.3 | T | 36.1% |
| Alabama | 137.4 | T | 34.4% |
| South Carolina | 137.3 | T | 40.7% |
| Tennessee | 136.2 | T | 34.7% |
| Texas | 135.1 | T | 43.2% |
| South Dakota | 134.7 | T | 31.7% |
| Maine | 132.2 | C | 47.8% |
| Missouri | 131.9 | T | 38.1% |
| Colorado | 131.8 | C | 48.2% |
| Arizona | 131.4 | T | 45.1% |
| Idaho | 129.6 | T | 27.5% |
| Delaware | 128.8 | C | 53.4% |
| Arkansas | 127.3 | T | 33.7% |
| Minnesota | 126.4 | C | 46.4% |
| Ohio | 126.1 | T | 43.6% |
| Michigan | 126.0 | T | 47.3% |
| Kentucky | 125.3 | T | 32.7% |
| Nebraska | 124.4 | T | 33.7% |
| Vermont | 124.3 | C | 56.7% |
| Indiana | 123.3 | T | 37.8% |
| Alaska | 123.0 | T | 36.6% |
| New Mexico | 122.1 | C | 48.3% |
| Montana | 121.5 | T | 35.7% |
| North Dakota | 120.3 | T | 27.2% |
| Iowa | 118.9 | T | 41.7% |
| Utah | 117.8 | T | 27.5% |
| Oklahoma | 116.2 | T | 28.9% |
| West Virginia | 116.0 | T | 26.5% |
| Wyoming | 114.5 | T | 21.9% |
| Correlation: | 0.687 | ||
James Galbraith is an economist, who teaches at the LBJ School of Public Affairs, The University of Texas at Austin, and directs the University of Texas Inequality Project, at http://utip.lbj.utexas.edu. His most recent book is Inequality: What Everyone Needs to Know (Oxford, 2016).
Top image by DonkeyHotey (Hillary Clinton vs. Donald Trump - Caricatures) [CC BY-SA 2.0], via Wikimedia Commons


Republicans?
Galbraith writes: Of course, we have already seen that Republicans have no real interest in delivering their promised manufacturing revival.
If memory serves, it was not "Republicans" who promised a manufacturing revival; it was Trump. Trump is not a Republican, if by "Republican" one means a member in good standing of the Grand Old Party. In fact, he is emphatically not so, as the Republican Party--as a political party, as the majority political party--is essentially as hostile to him as are the Democrats.
Also, it still amazes me that so many people in this country continue to accept the now-obsolete (well, it was always more fiction than reality in any case) narrative that inequality, the fabled 1% and 0.1%, the "rich," "corporate fatcats" &c &c, belong uniquely or even principally to Republicans. The data clearly demonstrate otherwise. So when will Thomas Frank write What's the matter with Massachusetts? He won't, of course, because he so utterly fails to understand the real basis of our politics (hint: it's not "inequality").