
The Census Bureau released its 2016 county level population estimates earlier this year. This gave us a window into the places that are gaining or losing total population.
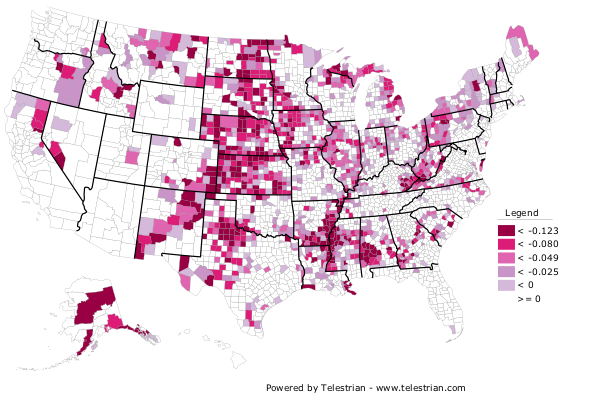
Here’s a map of all the counties that have lost population since 2010.
The numbers in the legend are the percentage change in population (multiply by 100).
But just last week the Census Bureau released the population estimates by age, sex, and race. I popped the age estimates into my database and mapped the counties whose child population (those under 18) is in decline. This is the demographic future of these communities apart from migration. Here’s that map:
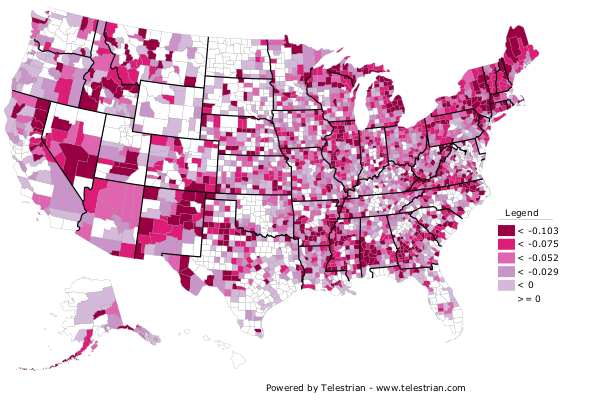
Yikes!
I also rolled this up to to the metro area level – and there are even a number of major metropolitan areas in the US – 25 out of 53 – with a declining population under the age of 18.
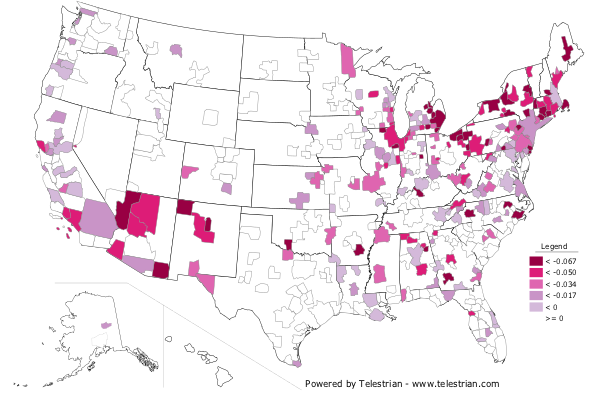
This is a very quick preliminary view for the blog. I’d definitely go dig into these numbers yourself before taking them to the bank. But this doesn’t look good for much of the country.
This piece originally appeared on Urbanophile.
Aaron M. Renn is a senior fellow at the Manhattan Institute, a contributing editor of City Journal, and an economic development columnist for Governing magazine. He focuses on ways to help America’s cities thrive in an ever more complex, competitive, globalized, and diverse twenty-first century. During Renn’s 15-year career in management and technology consulting, he was a partner at Accenture and held several technology strategy roles and directed multimillion-dollar global technology implementations. He has contributed to The Guardian, Forbes.com, and numerous other publications. Renn holds a B.S. from Indiana University, where he coauthored an early social-networking platform in 1991.
Photo by Abe Kleinfeld, via Flickr, using CC License.


