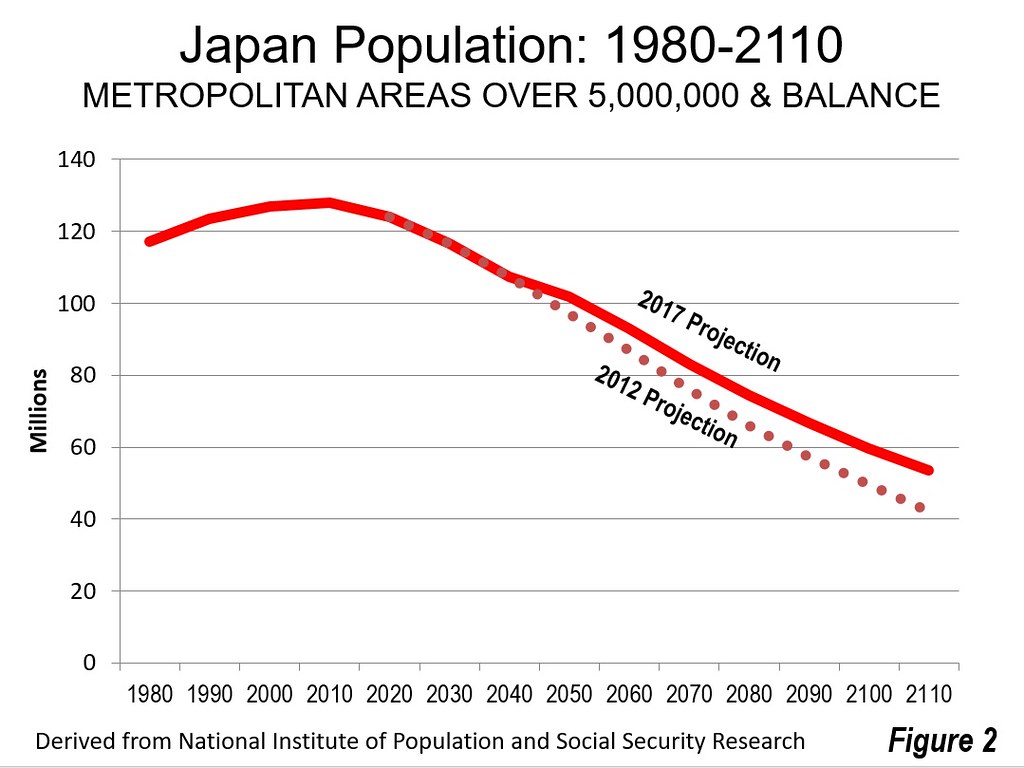
Japan is well known for its huge expected population loss, likely to be the greatest in the world for a major nation by the end of the century. However, things do not look as bleak as they did just five years ago. The National Institute of Population and Social Security Research (Japan) just released its 100 year population national projections based upon the results of the 2015 census, which is an update of the 2012 projections based on the 2010 census. The projections are virtually identical until 2040, when Japan’s population is expected to be approximately 107 million, down from the 2015 level of 127 million. After that time, however, the population loss is expected to moderate. By 2110, the population under the medium fertility/medium mortality scenario is projected to be 53.4 million, down more than 70 million from the 2010 peak of 128 million (Figure 1). This is more than 10 million higher than projections released in 2012, which anticipated 42.9 million residents in 2110, approximately equal to the population of the Nagoya metropolitan area (prefecture based).
The Largest Cities
Projections are not available beyond 2040 below the national level. However, the latest 2040 prefectural population projections, based on the 2010 census, give an idea of how the loss is likely to be distributed in the early years.
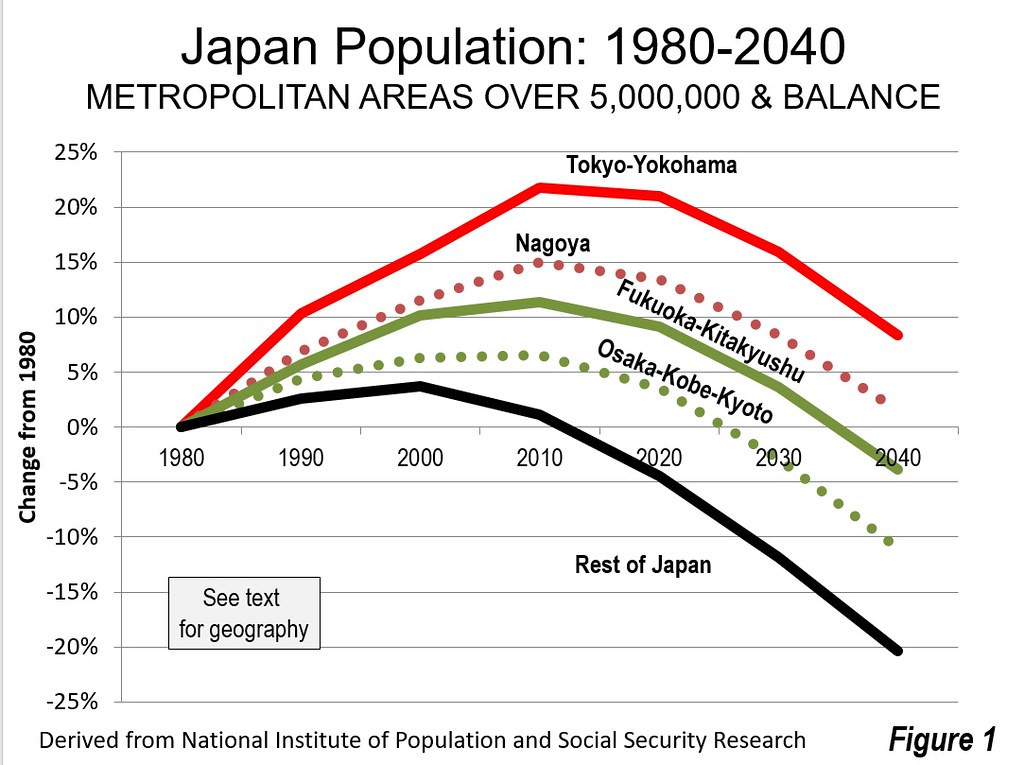
Japan has four cities (metropolitan areas) with more than 5 million residents that can be roughly delineated by prefectural boundaries, Tokyo – Yokohama, Osaka – Kobe – Kyoto, Nagoya and Fukuoka –Kitakyushu. These areas are expected to do much better in future population trends than the rest of the nation.
Figure 2 provides a comparison of the actual populations from 1980 to 2010 for these cities, along with projections to 2040. Tokyo – Yokohama retains the largest share of its population, falling 11.0 percent from its peak. This includes the prefectures of Tokyo, Kanagawa, Saitama, Chiba, Ibaraki, Toshigi, Gunma and Yamanishi. In 1980, Tokyo – Yokohama had a population of 36.7 million, which rose to 43.5 million in 2010 and is expected to fall to 38.7 million by 2040.
With strong growth continuing in places like Jakarta, Delhi and Manila, it seems unlikely that Tokyo - Yokohama will retain its “largest city in the world” status. Guanghou – Foshan – Shenzhen – Dongguan and the rest of the Pearl River Delta may also emerge as a larger metropolitan area should high levels of commuting develop (metropolitan areas are normally delineated by commuting patterns).
The second largest city, Osaka – Kobe – Kyoto is expected to do more poorly, with the loss of 16.5 percent. Osaka – Kobe – Kyoto includes the prefectures of Osaka, Hyogo, Kyoto and Nara. In 1980, Osaka – Kobe – Kyoto had a population of 17.4 million, which rose to 18.5 million in 2010 and is expected to fall to 15.4 million by 2040.
Nagoya, the third largest city, does nearly as well as Tokyo – Yokohama, losing 11.7 percent of its population. This includes the prefectures of Aichi, Gifu and Mie. In 1980, Nagoya had a population of 9.8 million, which rose to 11.3 million in 2010 and is expected to fall to 10.0 million by 2040.
Fukuoka – Kitakyushu (Fukuoka prefecture) is expected to lose 13.7 percent of its population between 2010 and 2040. In 1980, Fukuoka – Kitakyushu had a population of 4.6 million, which rose to 5.1 million in 2010 and is expected to fall to 4.4 million by 2040.
The population losses in the rest of the nation are expected to be more severe, at 21.2 percent. Outside the four largest cities, there was a 1980 population of 54.1 million, which rose to 54.8 million in 2010 and is expected to fall to 43.1 million by 2040.
2040 Prefecture Projections
Among the country’s 47 prefectures, only two are outside the four largest cities. Okinawa would lose the least population, 2.9 percent (Table). Shiga, which is sandwiched between Osaka – Kobe – Kyoto and Nagoya would have the second lowest population loss at 7.8 percent, just above that of Tokyo Prefecture, which is at the core of Tokyo-Yokohama. Fourth ranked Aichi is the core prefecture of Nagoya. Kanagawa and Saitama are in Tokyo – Yokohama, and Fukuoka includes Fukuoka – Kitakyushu. Chiba is in Tokyo – Yokohama, ninth-ranked Myagi includes the large city of Sendai, with 10th-ranked Kyoto being a part of the Osaka – Kobe – Kyoto metropolitan area. Osaka, the core prefecture of Osaka – Kobe – Kyoto ranks 12th. Generally, the core areas are expected to retain their population better than the more outlying areas.
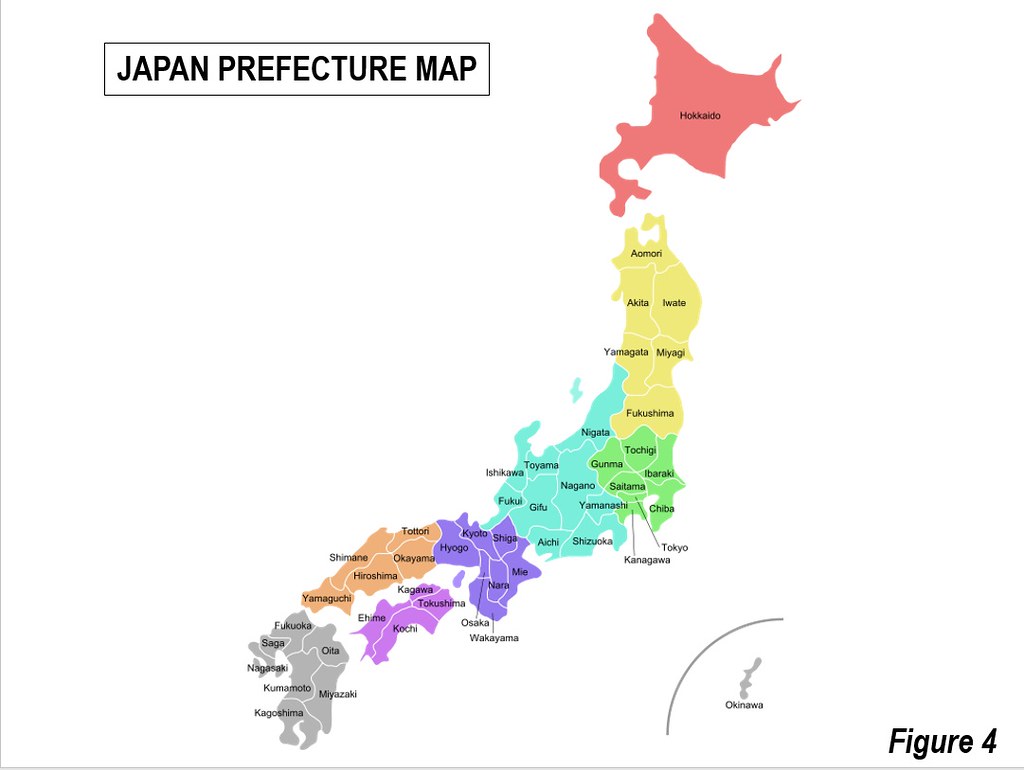
The prefectures with the largest losses tend to be more rural. The greatest losses are projected to be in on the northern part of Honshu (the main island), in Akita (31.6 percent), Amore (28.6 percent) and Iwate (25.9 percent). Kochi, on the island of Shikoku would have the third greatest loss, at 26.5 percent (See Japan Prefecture map - Figure 3).
Conjectural Projections
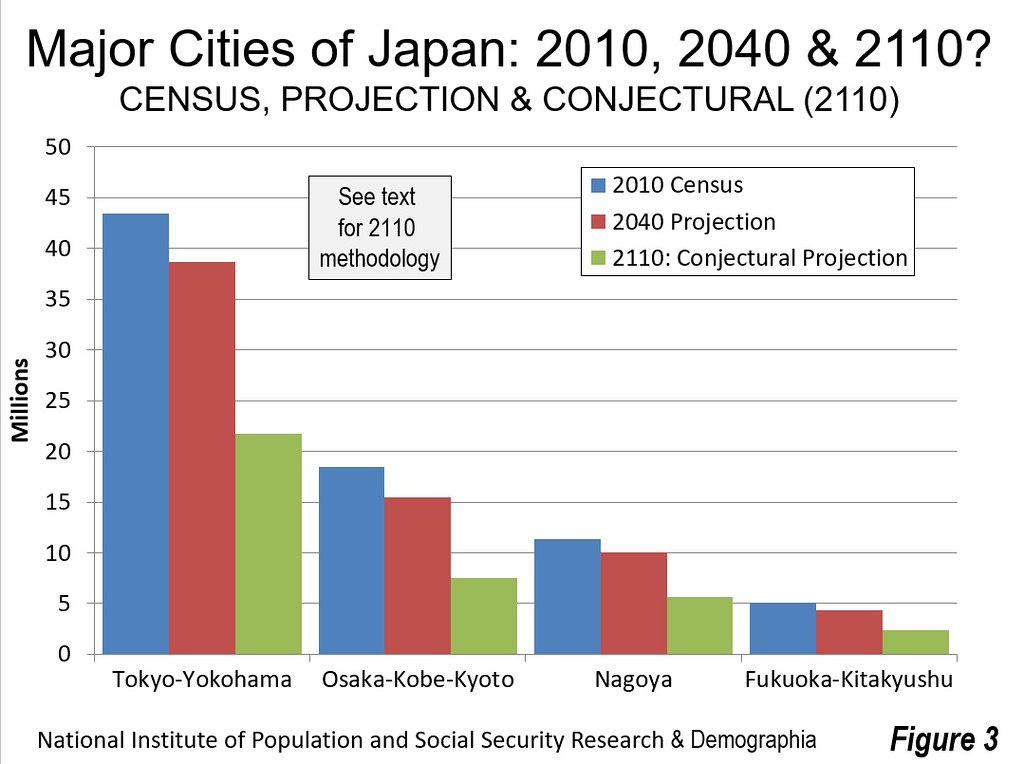
A “what if” analysis was performed to conjecture about what Japan might look like below the national level by 2110, when its 53 million population is projected to be nearly 60 percent below the 2010 peak. A population change factor was computed averaging the share of population losses for each prefecture from 2020 to 2040 and the overall share of the population expected to be in each prefecture in 2040.
The “what if” scenario suggests that population losses in each of the largest cities will be more than 50 percent from 2010, the population losses in Tokyo-Yokohama and Nagoya would be just under 50 percent. Fukuoka – Kitakyushu would lose 54 percent, while Osaka – Kobe – Kyoto would drop nearly 60 percent (Figure 4). Each of these, however, would be far better than the rest of the nation, with a decline of nearly 70 percent.
However, at the prefectural level, prefectures without larger cities would drop even more (Table). Only Okinawa, Shiga, Tokyo, Aichi and Kanagawa would lose less than half their population. At the other end of the scale, Akita, Amore, Kochi and Iwate would lose 80 to 90 percent of their population.
However, the population loss is distributed. The Japan of 2110 is likely to be radically different than today. At the same time, population projections are no more than projections and no one can know the future for sure. But Japan seems likely to face serious challenges from population losses in the decades to come, perhaps a harbinger of what can happen in an increasingly post-familial world.
By Tokyoship (Own work) [Public domain], via Wikimedia Commons
| Japan: Population by Prefecture 2010 to 2040 Projection and 2110 | ||||||
| Rank | Prefecture | 2010 Census | 2040 Projection | Change from 2010 | 2110 Comectural | Change from 2010 |
| 1 | Okinawa | 1.393 | 1.369 | -2.9% | 0.950 | -31.8% |
| 2 | Shiga | 1.411 | 1.309 | -7.8% | 0.813 | -42.4% |
| 3 | Tokyo | 13.159 | 12.308 | -7.8% | 7.606 | -42.2% |
| 4 | Aichi | 7.411 | 6.856 | -8.2% | 4.199 | -43.3% |
| 5 | Kanagawa | 9.048 | 8.343 | -8.8% | 5.004 | -44.7% |
| 6 | Saitama | 7.195 | 6.305 | -12.5% | 3.397 | -52.8% |
| 7 | Fukuoka | 5.072 | 4.379 | -13.2% | 2.339 | -53.9% |
| 8 | Chiba | 6.216 | 5.358 | -13.5% | 2.790 | -55.1% |
| 9 | Miyagi | 2.348 | 1.973 | -14.4% | 1.003 | -57.3% |
| 10 | Kyoto | 2.636 | 2.224 | -15.0% | 1.116 | -57.7% |
| 11 | Hiroshima | 2.861 | 2.391 | -15.4% | 1.191 | -58.4% |
| 12 | Osaka | 8.865 | 7.454 | -15.4% | 3.670 | -58.6% |
| 13 | Ishikawa | 1.170 | 0.974 | -15.5% | 0.484 | -58.6% |
| 14 | Hyogo | 5.588 | 4.674 | -15.5% | 2.303 | -58.8% |
| 15 | Okayama | 1.945 | 1.611 | -15.8% | 0.796 | -59.1% |
| 16 | Tochigi | 2.008 | 1.643 | -16.7% | 0.778 | -61.2% |
| 17 | Ibaraki | 2.970 | 2.423 | -17.1% | 1.127 | -62.1% |
| 18 | Mie | 1.855 | 1.508 | -17.2% | 0.704 | -62.0% |
| 19 | Gunma | 2.008 | 1.630 | -17.3% | 0.756 | -62.4% |
| 20 | Kumamoto | 1.817 | 1.467 | -17.4% | 0.687 | -62.2% |
| 21 | Saga | 0.850 | 0.680 | -17.8% | 0.313 | -63.1% |
| 22 | Shizuoka | 3.765 | 3.035 | -17.9% | 1.368 | -63.7% |
| 23 | Oita | 1.197 | 0.955 | -18.3% | 0.429 | -64.1% |
| 24 | Gifu | 2.081 | 1.660 | -18.5% | 0.733 | -64.8% |
| 25 | Miyazaki | 1.135 | 0.901 | -18.7% | 0.398 | -64.9% |
| 26 | Fukui | 0.806 | 0.633 | -19.3% | 0.272 | -66.3% |
| 27 | Nara | 1.401 | 1.096 | -20.0% | 0.447 | -68.1% |
| 28 | Nagano | 2.152 | 1.668 | -20.2% | 0.689 | -68.0% |
| 29 | Kagawa | 0.996 | 0.773 | -20.2% | 0.317 | -68.2% |
| 30 | Kagoshima | 1.706 | 1.314 | -20.3% | 0.546 | -68.0% |
| 31 | Yamanashi | 0.863 | 0.666 | -20.5% | 0.271 | -68.6% |
| 32 | Toyama | 1.093 | 0.841 | -20.9% | 0.331 | -69.7% |
| 33 | Hokkaido | 5.506 | 4.190 | -21.8% | 1.558 | -71.7% |
| 34 | Niigata | 2.374 | 1.791 | -22.0% | 0.671 | -71.7% |
| 35 | Tottori | 0.589 | 0.441 | -22.2% | 0.165 | -72.0% |
| 36 | Ehime | 1.431 | 1.075 | -22.3% | 0.397 | -72.3% |
| 37 | Fukushima | 2.029 | 1.485 | -22.3% | 0.491 | -75.8% |
| 38 | Nagasaki | 1.427 | 1.049 | -23.5% | 0.363 | -74.6% |
| 39 | Yamaguchi | 1.451 | 1.070 | -23.5% | 0.369 | -74.6% |
| 40 | Shimane | 0.717 | 0.521 | -24.2% | 0.174 | -75.7% |
| 41 | Tokushima | 0.785 | 0.571 | -24.4% | 0.185 | -76.4% |
| 42 | Yamagata | 1.169 | 0.836 | -25.1% | 0.263 | -77.5% |
| 43 | Wakayama | 1.002 | 0.719 | -25.2% | 0.222 | -77.8% |
| 44 | Iwate | 1.330 | 0.938 | -25.9% | 0.273 | -79.5% |
| 45 | Kochi | 0.764 | 0.537 | -26.5% | 0.151 | -80.3% |
| 46 | Aomori | 1.373 | 0.932 | -28.6% | 0.211 | -84.6% |
| 47 | Akita | 1.086 | 0.700 | -31.6% | 0.109 | -90.0% |
| 2010 and 2040 data from the National Institute for Population & Social Security Research | ||||||
| 2110 dsta from Demographia. See text. | ||||||
Wendell Cox is principal of Demographia, an international public policy and demographics firm. He is a Senior Fellow of the Center for Opportunity Urbanism (US), Senior Fellow for Housing Affordability and Municipal Policy for the Frontier Centre for Public Policy (Canada), and a member of the Board of Advisors of the Center for Demographics and Policy at Chapman University (California). He is co-author of the "Demographia International Housing Affordability Survey" and author of "Demographia World Urban Areas" and "War on the Dream: How Anti-Sprawl Policy Threatens the Quality of Life." He was appointed to three terms on the Los Angeles County Transportation Commission, where he served with the leading city and county leadership as the only non-elected member. He served as a visiting professor at the Conservatoire National des Arts et Metiers, a national university in Paris.
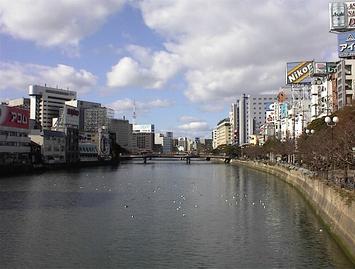
Photo: Fukuoka (by author)


