
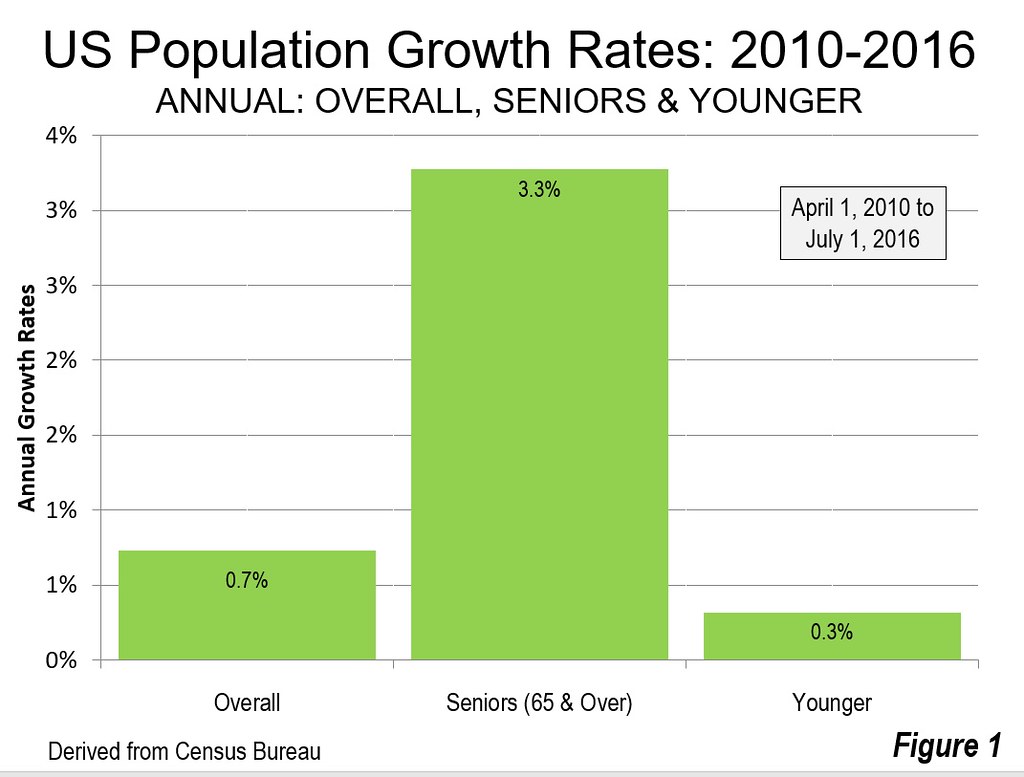
Around the world, including the United States, senior populations are rising much faster than those of other ages, as fertility rates have plummeted. Since the 2010 Census, the share of US population 65 years of age and older has risen 3.3 percent annually, more than four times the overall average of 0.7 percent and more than ten times the 0.3 percent average growth rate for people under 65 years of age (Figure 1).
This article examines senior growth by labor/housing market. This includes all 933 markets designated by the Office of Management and Budget based upon commuting data (metropolitan areas and micropolitan areas) and includes those not designated (Note).
Markets Where Senior Gains Have Been the Most and Least
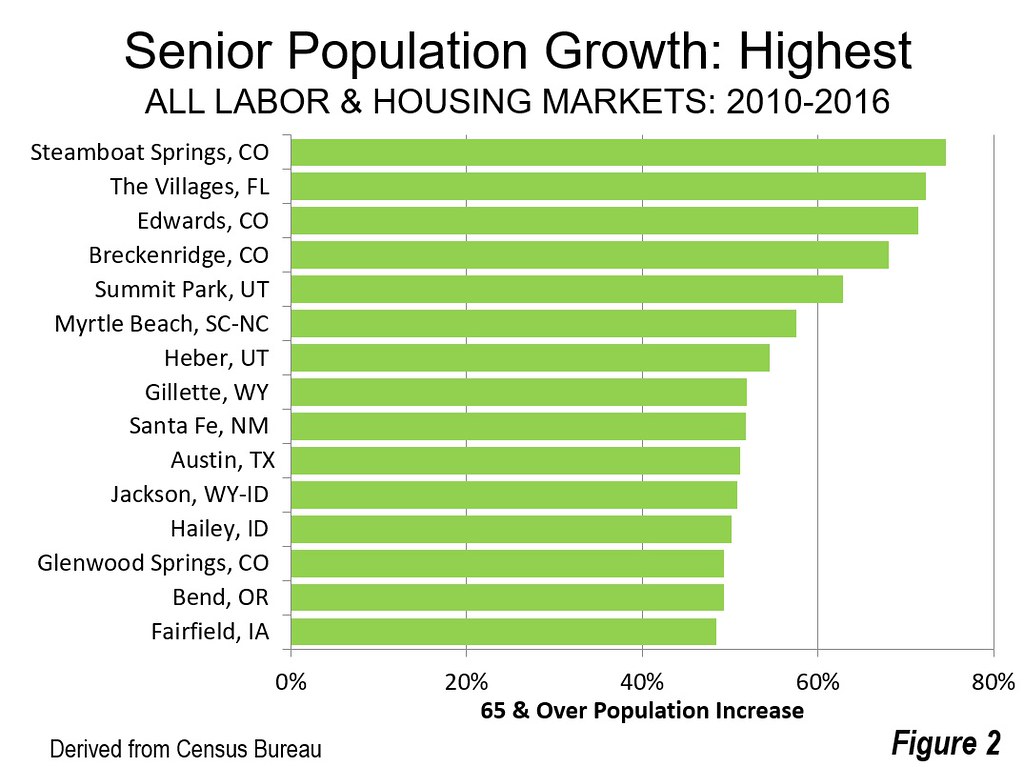
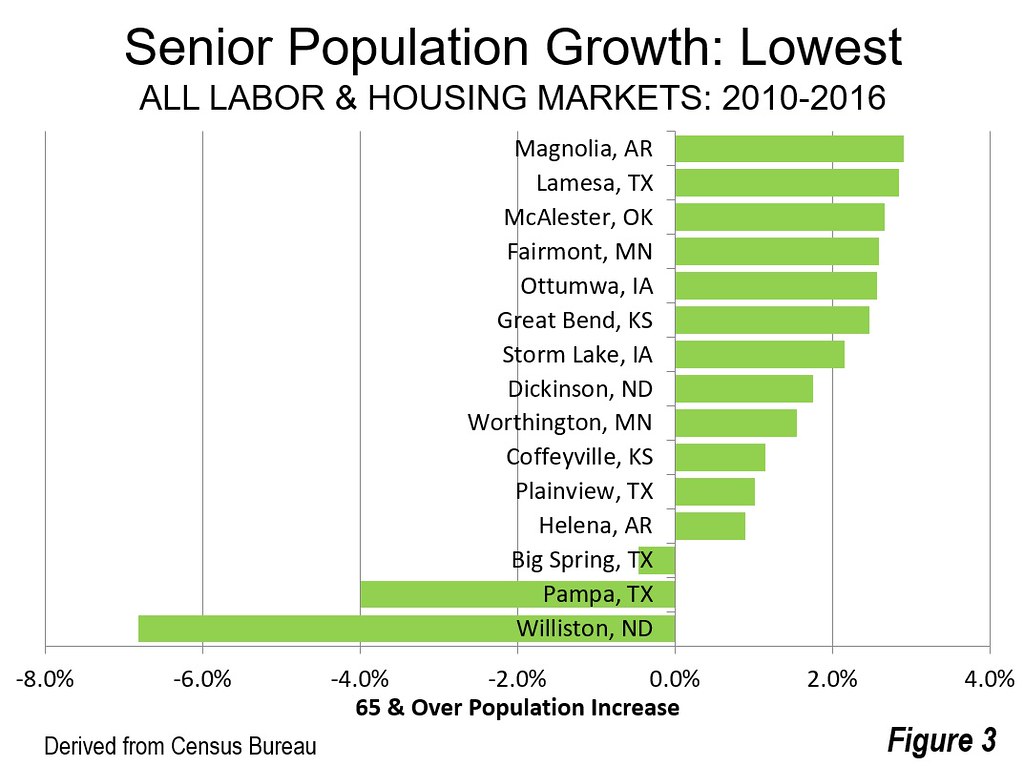
The largest senior population percentage gains have been in areas considered prime retirement markets. Senior population is up the most, near 80 percent, in Steamboat Springs, Colorado. The Villages, Florida and Edwards, Colorado also had increases over 70 percent. The 15 fastest growing markets include four in Colorado and two each in Idaho and Utah. Only one of the top 15 is a major metropolitan area (over 1,000,000), Austin (Figure 2), which is in comparatively low tax and cost compared to most coastal metropolitan areas. The areas with the lowest senior growth rates were all smaller, with three areas having declines. The largest decline was in Williston, North Dakota, which has experienced substantial population growth among younger people during the expansion of the oil industry (Figure 3).
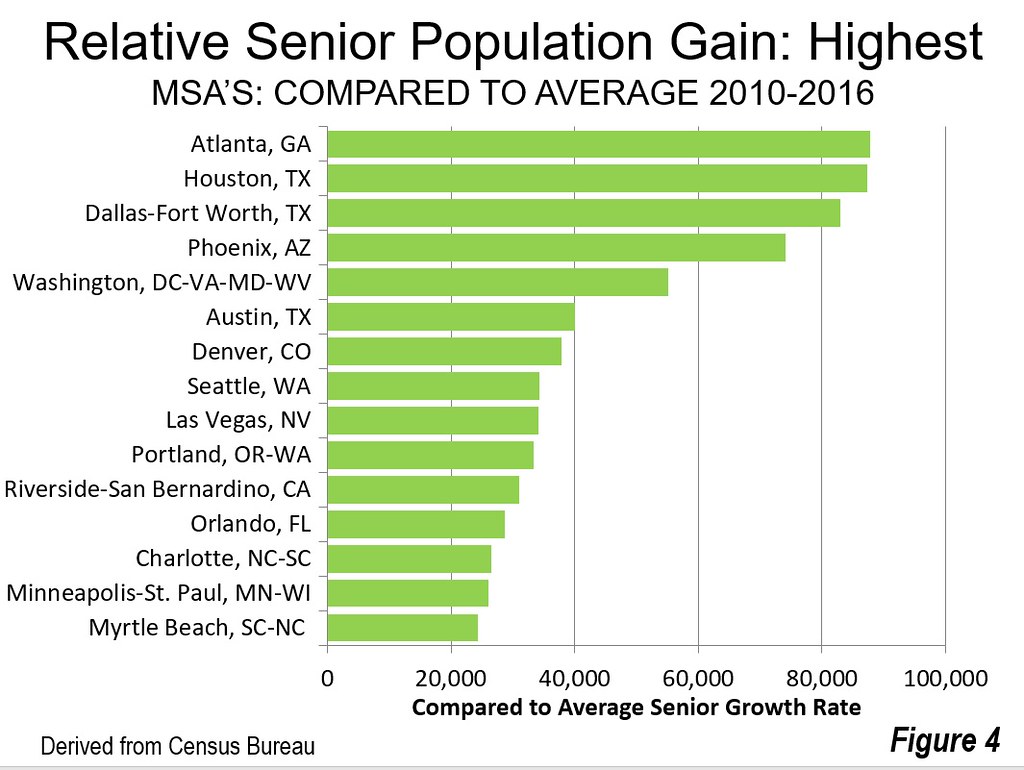
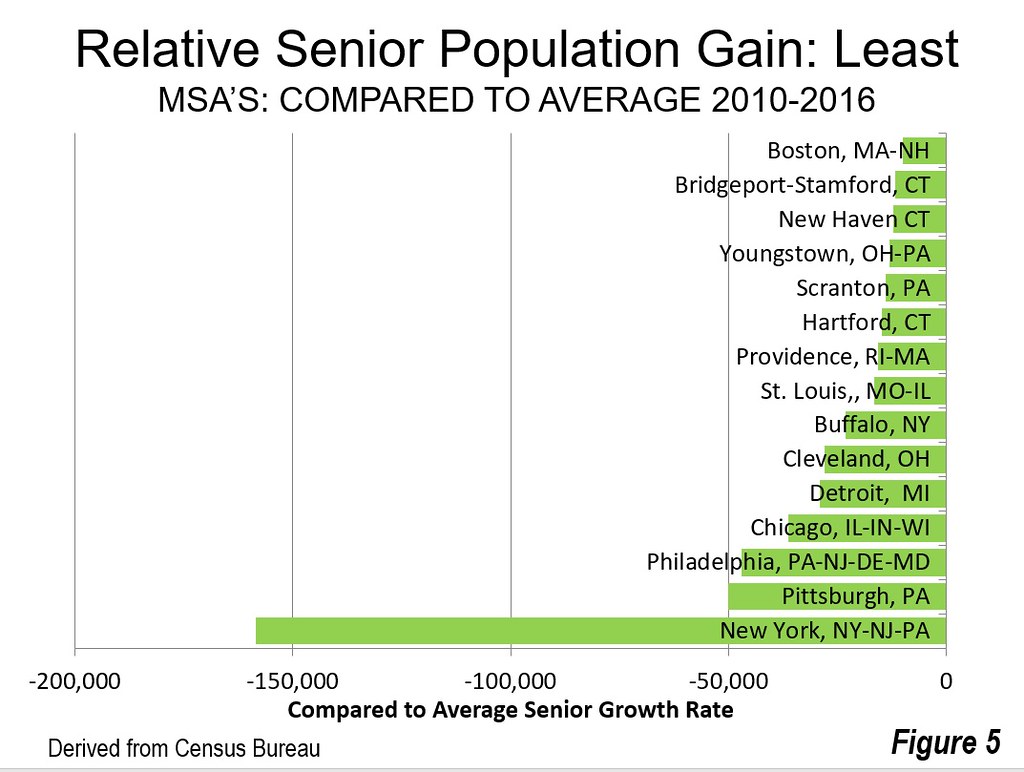
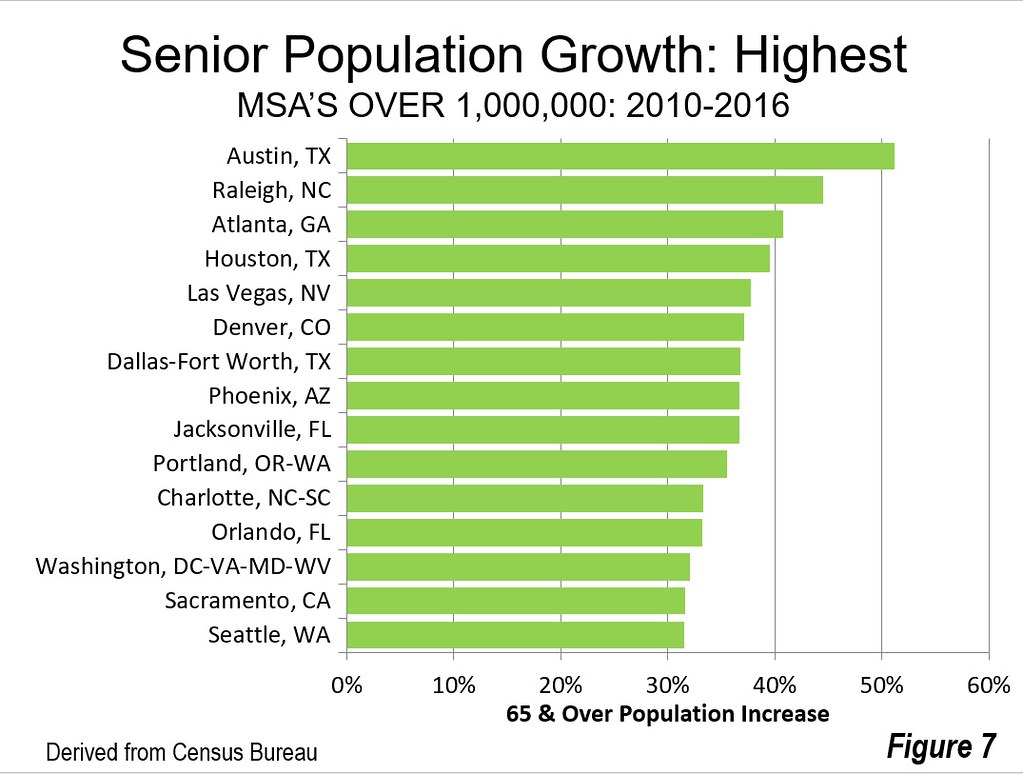
While senior domestic migration data is not readily available, trends can be roughly estimated by the extent to which growth has exceeded or fallen short of the national senior population growth rate. Fourteen of the 15 largest gains have occurred in the major metropolitan areas, led by Atlanta, Houston and Dallas-Fort Worth, where overall senior growth exceed by 80,000 the number that would have occurred at the national rate (Figure 4). The largest relative senior population losses have occurred in major metropolitan areas of the East and Midwest, with the greatest loss, by far, in the New York metropolitan area (Figure 5).
Senior Growth by Size of Labor/Housing Market
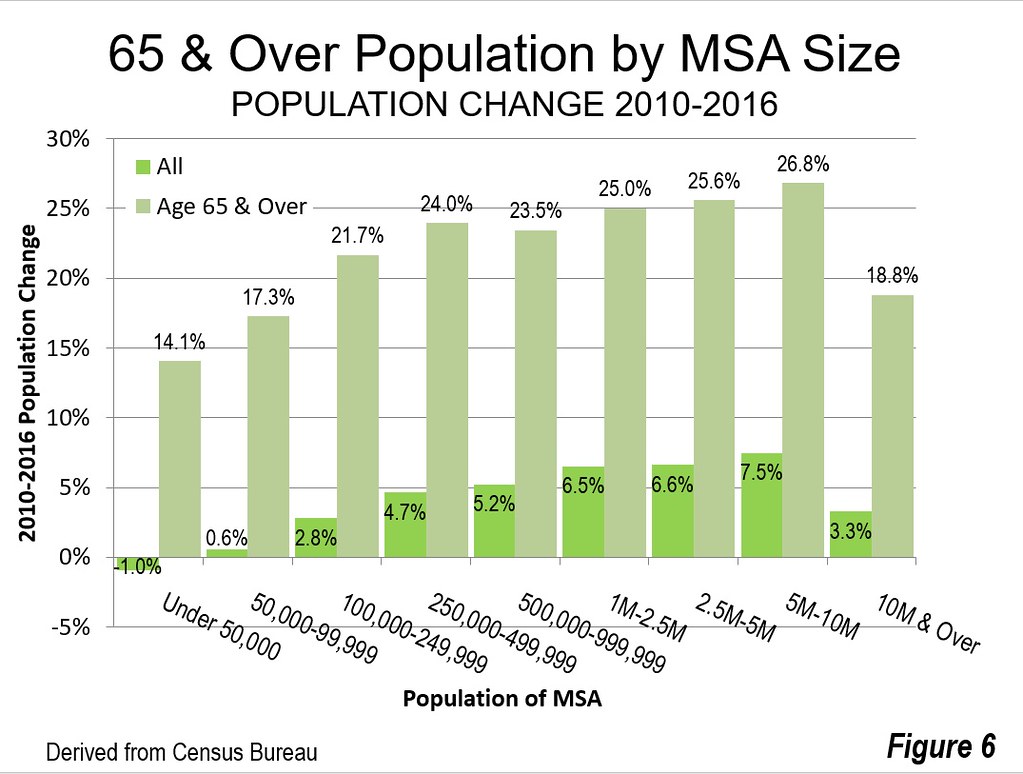
Senior population growth rates since 2010 have been from 15 to 19 percentage points greater than the overall population increase rate each of the labor/housing market population categories used in this article (Figure 6). The strongest growth rates, for both seniors and overall, have been in metropolitan areas from 1 million to 5 million. The 250,000 to 1,000,000 categories had somewhat slower growth rates. The megacities, over 10 million (New York and Los Angeles) had among the lowest growth rates. The lowest growth rates were in labor/housing markets with under 250,000 population.
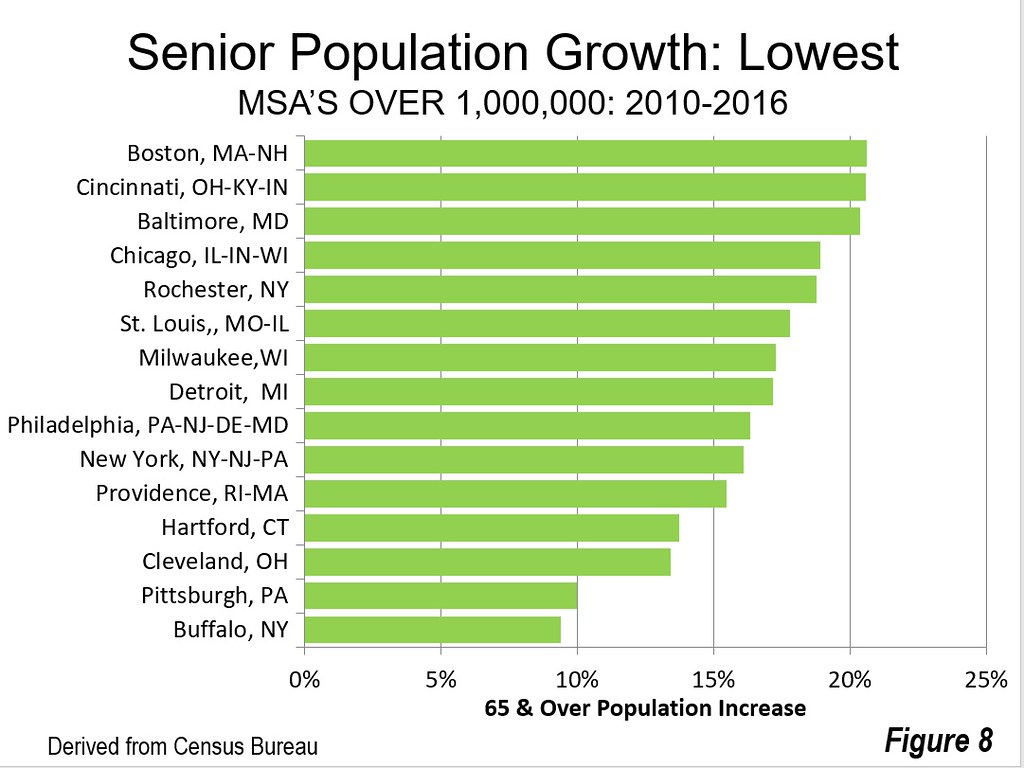
Markets over 1,000,000: Among the major metropolitan areas (over 1,000,000 population), all of the fastest growing 15 for seniors were in the South and West, led by Austin, Raleigh, Atlanta, Houston and Las Vegas (Figure 7). All 15 areas are more than 90 percent suburban and exurban, except for Seattle (89 percent) and Washington (83 percent). The slowest growing major metropolitan areas are all in the East and Midwest, except for nearby Baltimore, which is in the South (Figure 8). Ten of the 12 least suburbanized metropolitan areas are included among the 15 with the slowest senior growth rates, and includes four of the six “transit legacy cities,” New York, Chicago, Philadelphia and Boston. So much for the popular media meme of seniors flocking “back to the city.”
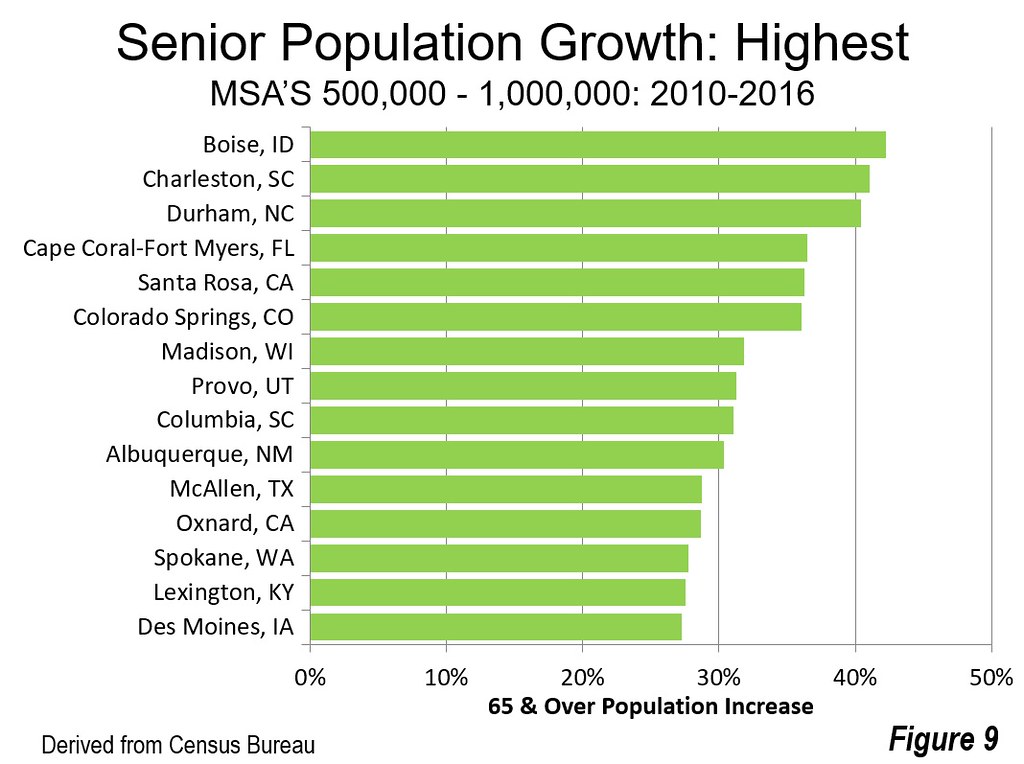
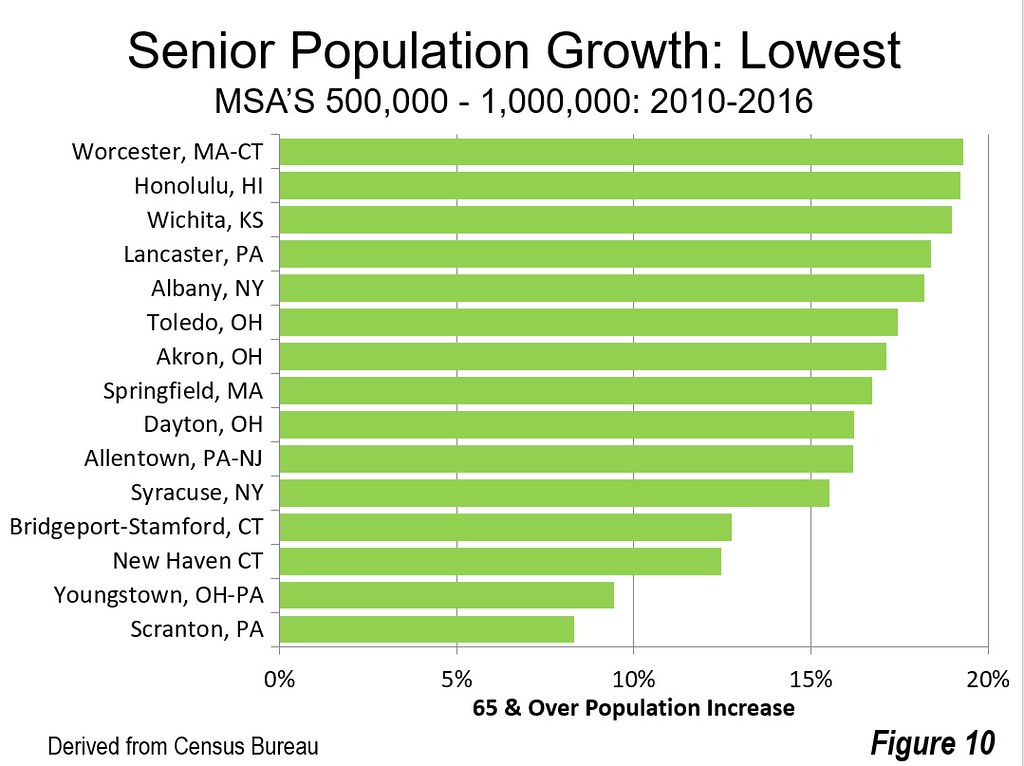
Markets 500,000 – 1,000,000: Boise, Charleston (SC) and Durham had the highest senior growth rates in the 500,000 to 1,000,000 category. All of the other top 15 were in the South or West except for Madison, WI and Des Moines (Figure 9). The lowest growth markets were all in the East and Midwest, with Scranton, PA and Youngstown, OH growing the least. All of the other bottom 15 were outside the East and Midwest, with the exceptions of Wichita and Honolulu (Figure 10).
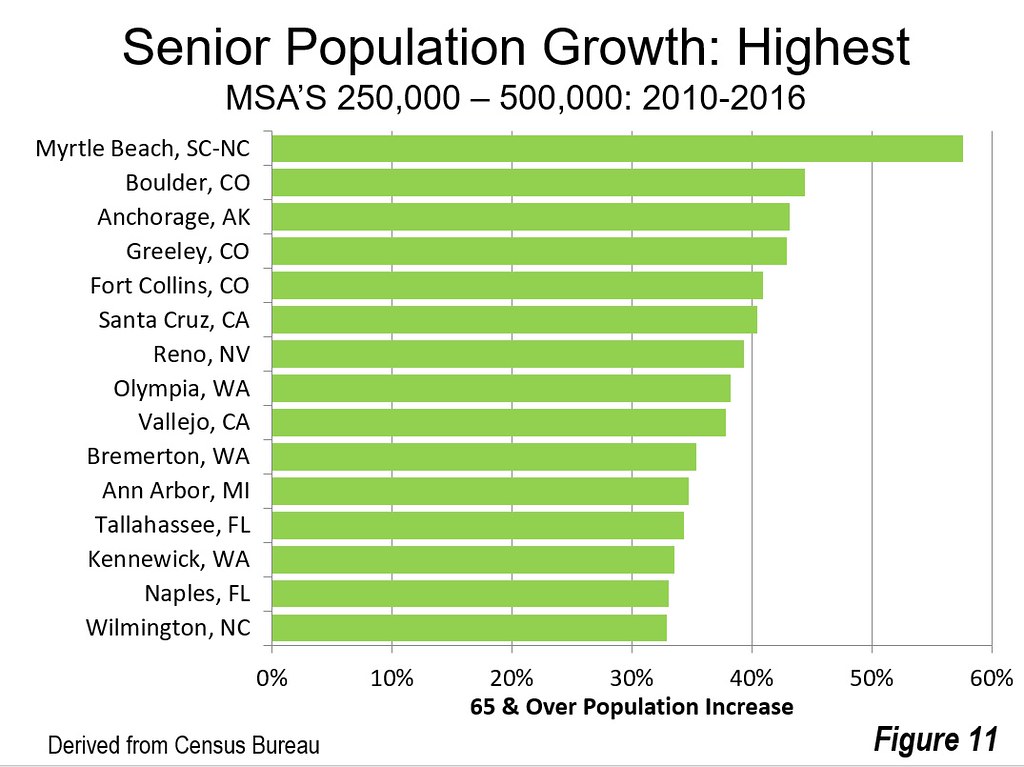
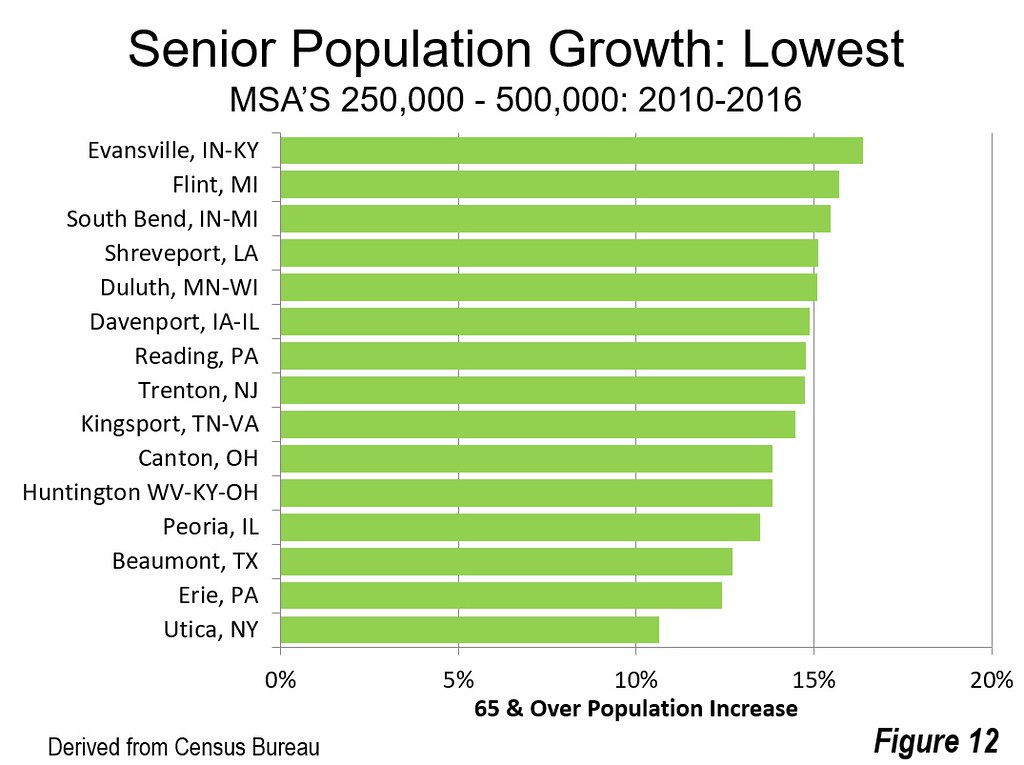
Markets 250,000 – 500,000: By far the highest growth in the 250,000 to 500,000 population markets was Myrtle Beach, SC-NC, growing nearly 60 percent (Figure 11). All of the fastest growth markets were in the South and West, except for Ann Arbor (MI). Utica (NY) and Erie (PA) had the slowest growth rates (Figure 12).
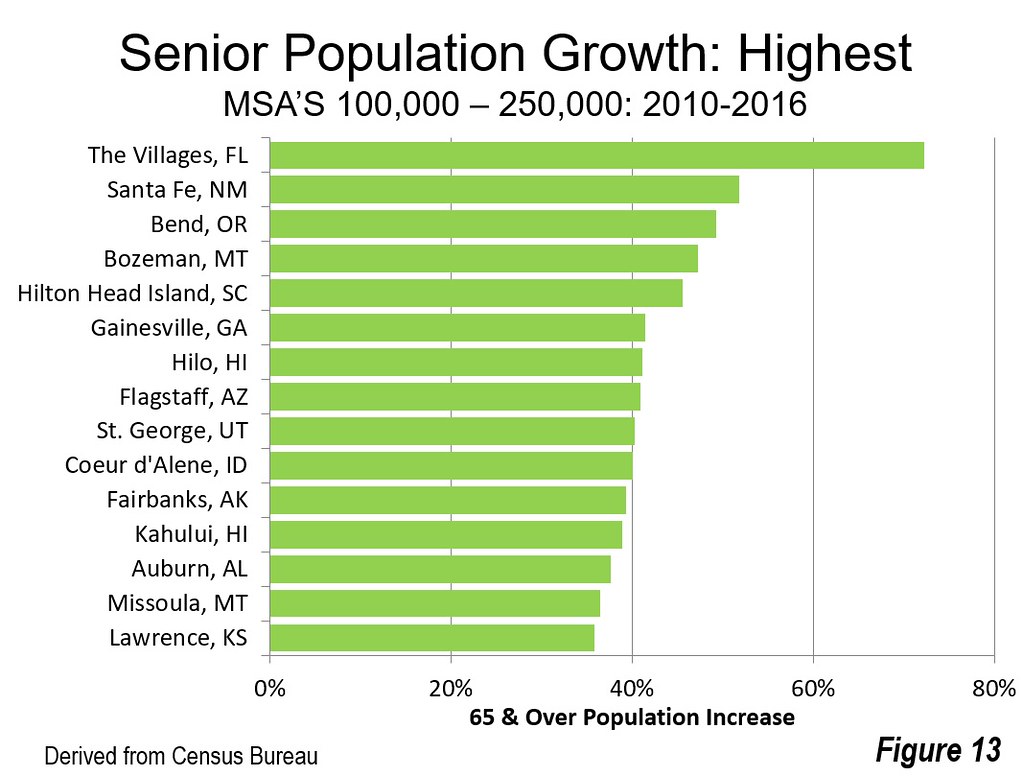
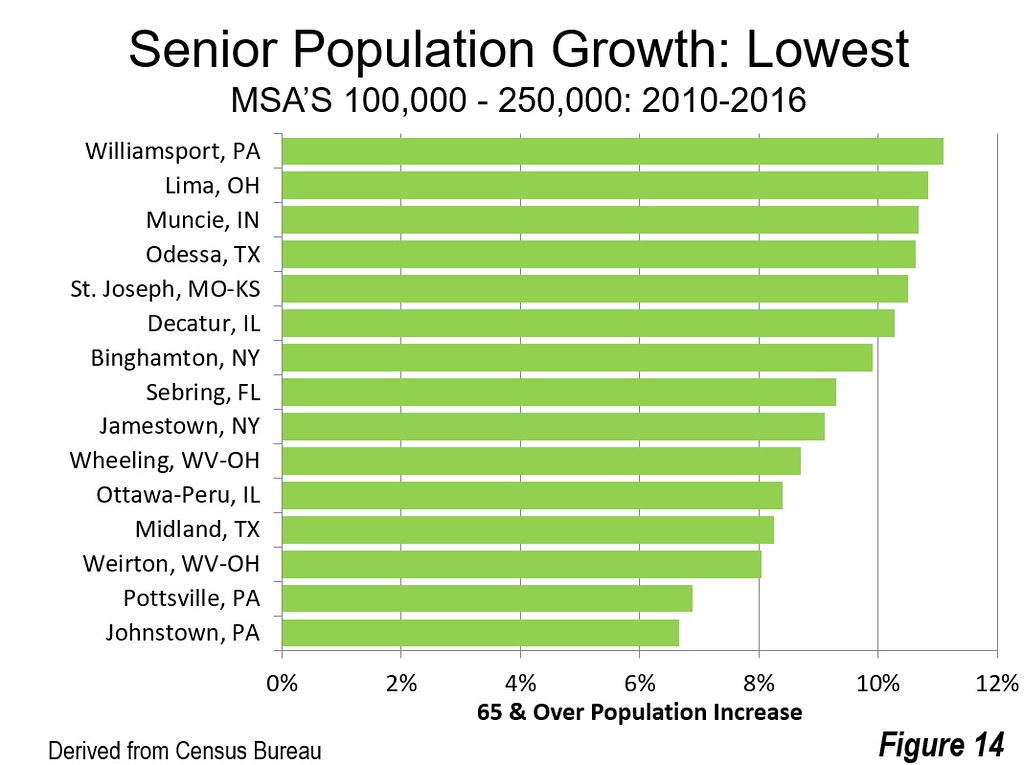
Markets 100,000 – 250,000: The Villages, FL had the largest senior growth rate in the 100,000 to 250,000 category. All in this category were in the South and West except for Lawrence, KS (Figure 13). All of the slowest senior growth rates were in the East and Midwest, except for Midland and Odessa in Texas. The slowest growing markets were Johnstown and Pottstown, PA (Figure 14).
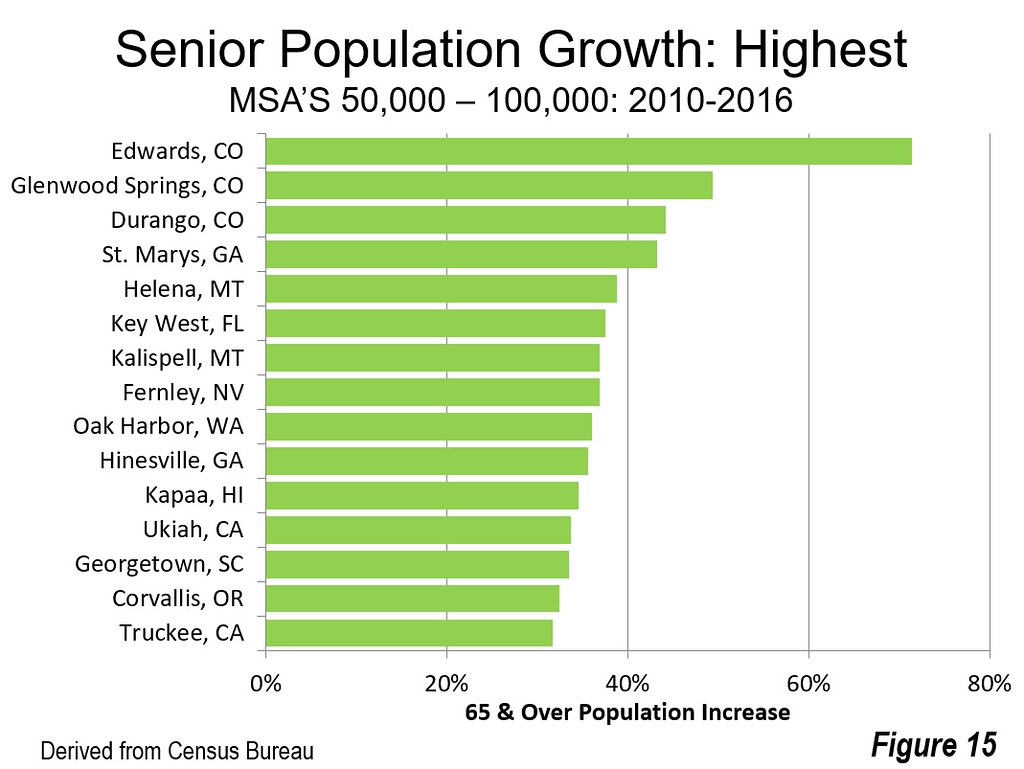
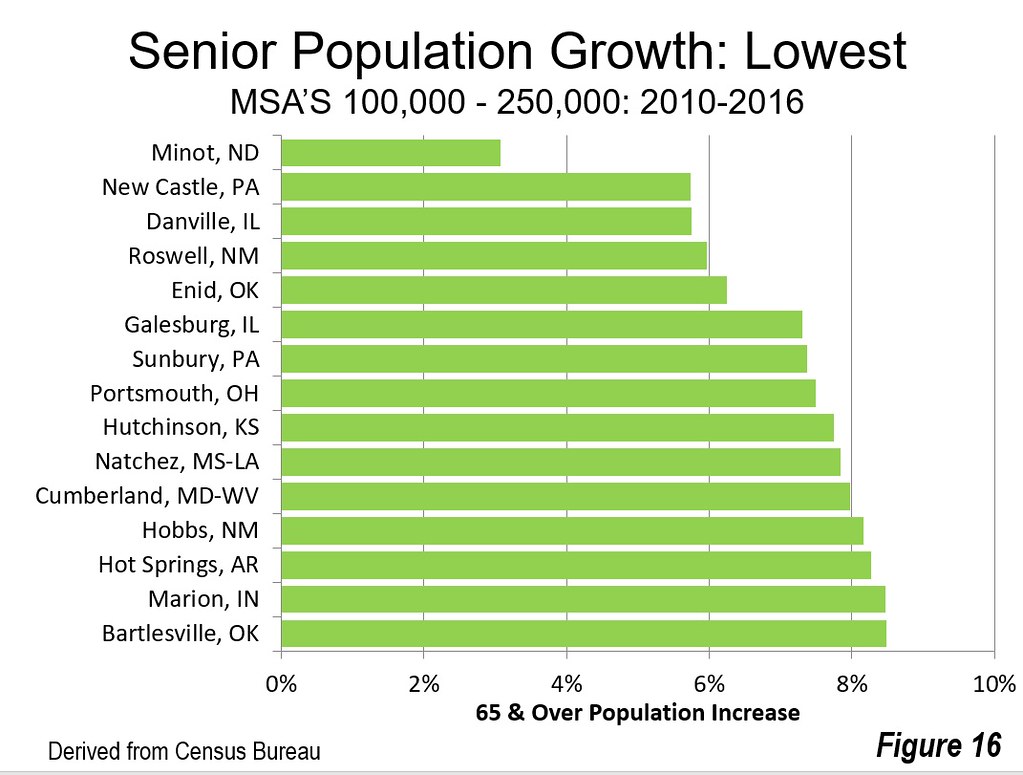
Markets 50,000 – 100,000: All of the highest senior growth rates in the 50,000 to 100,000 category were in the West or South, led by three Colorado markets, Edwards, Glenwood Springs and Durango (Figure 15). By far the slowest growth was in Minot, ND (Figure 16).
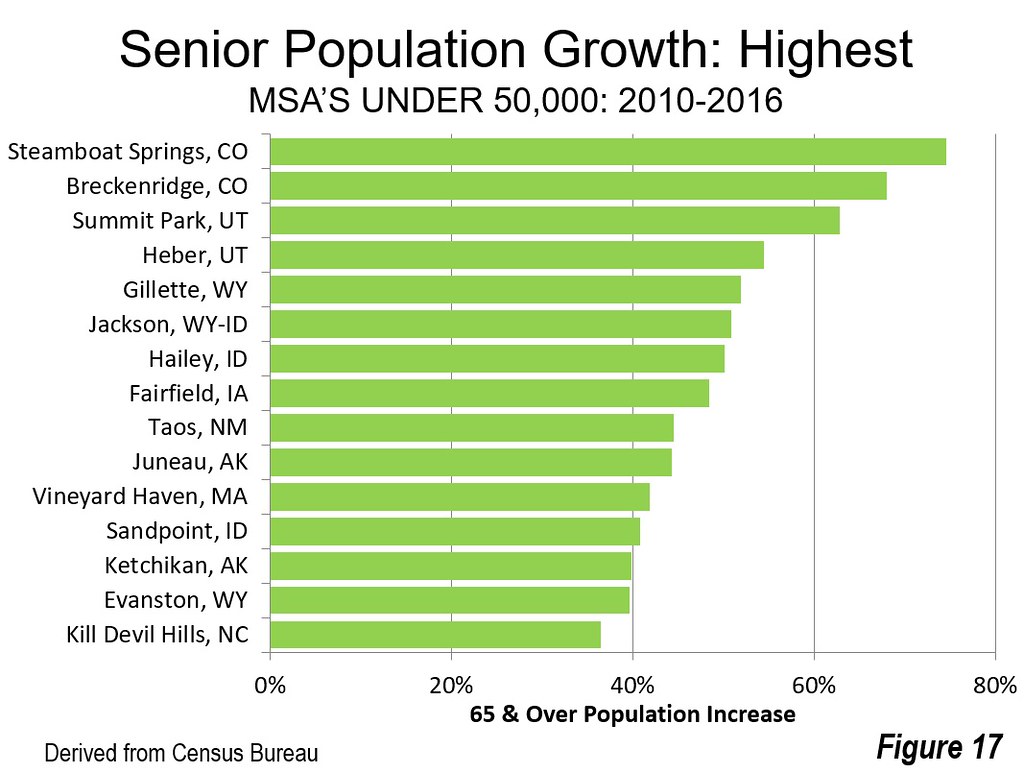
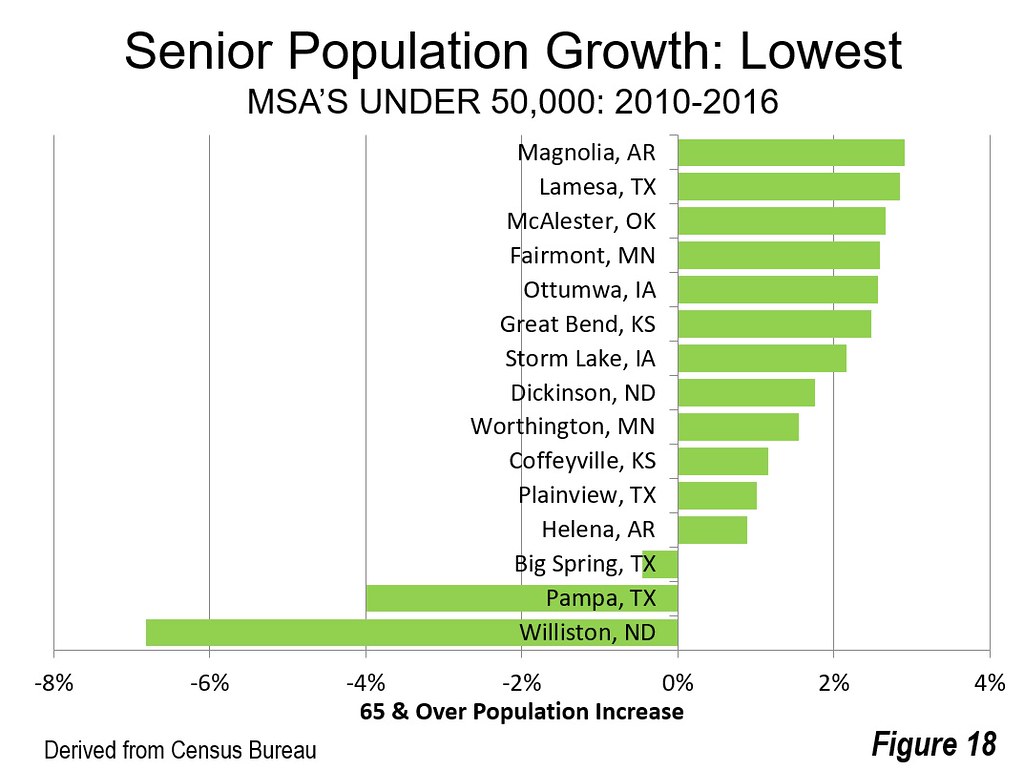
Markets Under 50,000: This category includes markets designated by the Office of Management and Budget and all undesignated markets (not defined as metropolitan or micropolitan areas). Among the designated markets, the fastest senior growth was in Steamboat Springs (Figure 17), CO, which had the highest growth rate among the 933 markets (above), followed by Breckenridge, CO. Only three senior population losses occurred among the 933 markets, all in the under 50,000 category, Williston, ND, Pampa, TX and Big Spring, TX (Figure 18).
Toward the South and West
In a previous article, we showed that senior population growth within the major metropolitan areas has been in the suburbs and exurbs. Overall, trends among all labor/housing markets is consistent with that finding, that senior growth is dominated by the South and West, where suburban form and suburban densities are nearly universal.
Note: A common error is the characterization of areas outside metropolitan areas as “rural.” In fact rural and urban definitions are independent of metropolitan areas. All metropolitan areas are both rural and urban. Indeed, labor/housing markets (such as metropolitan areas) are virtually all both urban and rural. Metropolitan areas include an urban area as the core and the rural areas (and smaller urban areas) from which a sufficient percentage of workers commute. Among the major metropolitan areas, more than 80 percent of the land area is rural (see: "Rural Character in America's Metropolitan Areas.")
Wendell Cox is principal of Demographia, an international public policy and demographics firm. He is a Senior Fellow of the Center for Opportunity Urbanism (US), Senior Fellow for Housing Affordability and Municipal Policy for the Frontier Centre for Public Policy (Canada), and a member of the Board of Advisors of the Center for Demographics and Policy at Chapman University (California). He is co-author of the "Demographia International Housing Affordability Survey" and author of "Demographia World Urban Areas" and "War on the Dream: How Anti-Sprawl Policy Threatens the Quality of Life." He was appointed to three terms on the Los Angeles County Transportation Commission, where he served with the leading city and county leadership as the only non-elected member. He served as a visiting professor at the Conservatoire National des Arts et Metiers, a national university in Paris.
Photograph: Steamboat Springs, Colorado: Fastest Growing Senior Population
https://upload.wikimedia.org/wikipedia/commons/3/38/Steamboat_Springs_do...


