
The headline trumpeted “Report: 98 Percent Of U.S. Commuters Favor Public Transportation For Others,” in a 2000 edition of The Onion, the leading national satirical newspaper. The spoof suggested a national transit promotional campaign with the slogan “Take The Bus… I'll Be Glad You Did,” and quoted a Los Angeles 80 mile daily commuter “Expanding mass transit isn't just a good idea, it's a necessity… My drive to work is unbelievable. I spend more than two hours stuck in 12 lanes of traffic. It's about time somebody did something to get some of these other cars off the road."
The Onion “Disconnect”: Transit’s Disproportionate Share of Long Commutes
The reality is that transit often polls well, being perceived as a means to reduce traffic congestion. Many billions have been spent on new rail systems to attract drivers from their cars to transit, often financed with tax money paid principally by households who predominantly use cars, not transit. Yet, 17 years after The Onion article, transit’s market share is stuck and in 2017, for the first time, the number of people working at home every day exceeded the number commuting on transit.
There is a substantial disconnect between public attitudes The Onion implies and how people actually commute. In fact, there are many 80 mile commuters and all of them spend more than one-hour commuting one way to work. And, they are disproportionately on transit.
This article describes 60 minute and longer commutes (referred to as “long commutes”) to transit destinations at the national level and by major metropolitan area (over 1,000,000 population) as reported for 2017 in the American Community Survey.
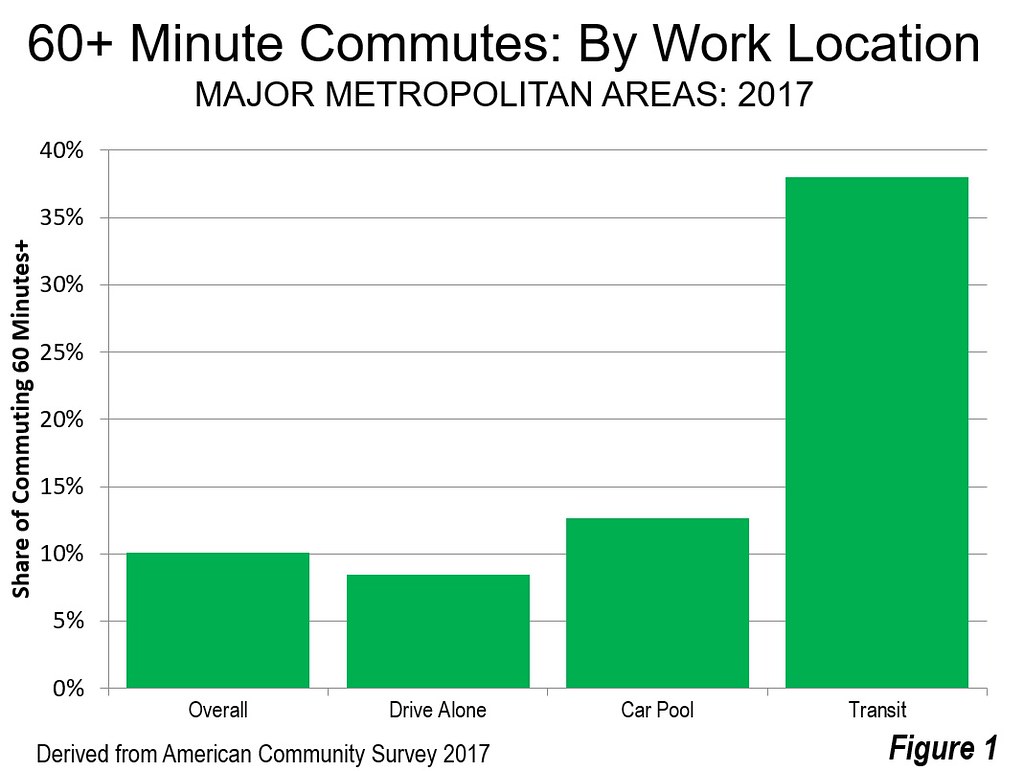
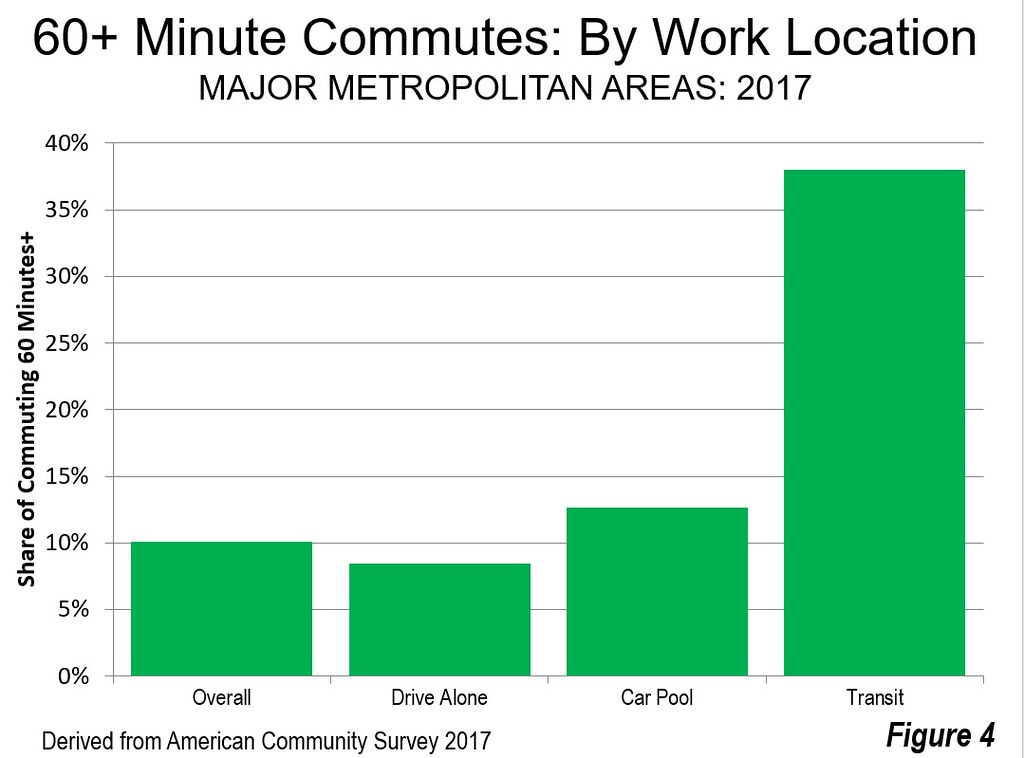
In 2017, 9.3 percent of US commuters spent 60 or more minutes each way traveling to work. Surprisingly, workers who drive alone are the least likely to have long commutes (7.4 percent). Those commuting by car pools are somewhat more likely to have long commutes (10.9 percent). But transit commuters are by far the most likely to have long commutes (39.0 percent). Thus, transit commuters are five times as likely to travel 60 or more minutes than those who drive alone (Figure 1).
Long Commutes in the 10 Strongest Transit Cities
Contrary to conventional wisdom, transit simply does not result in shorter commutes. Figure 2 portrays longer commute data for the 10 metropolitan areas with the largest transit work trip destination market share. This includes the overall percentage as well as the percentage for driving alone, car pools and transit. In each of the 10 cities, driving alone has the smallest share of long commutes. Additionally, in each city, car pools have a somewhat larger percentage of long commutes, while transit has the longest commute, by far.
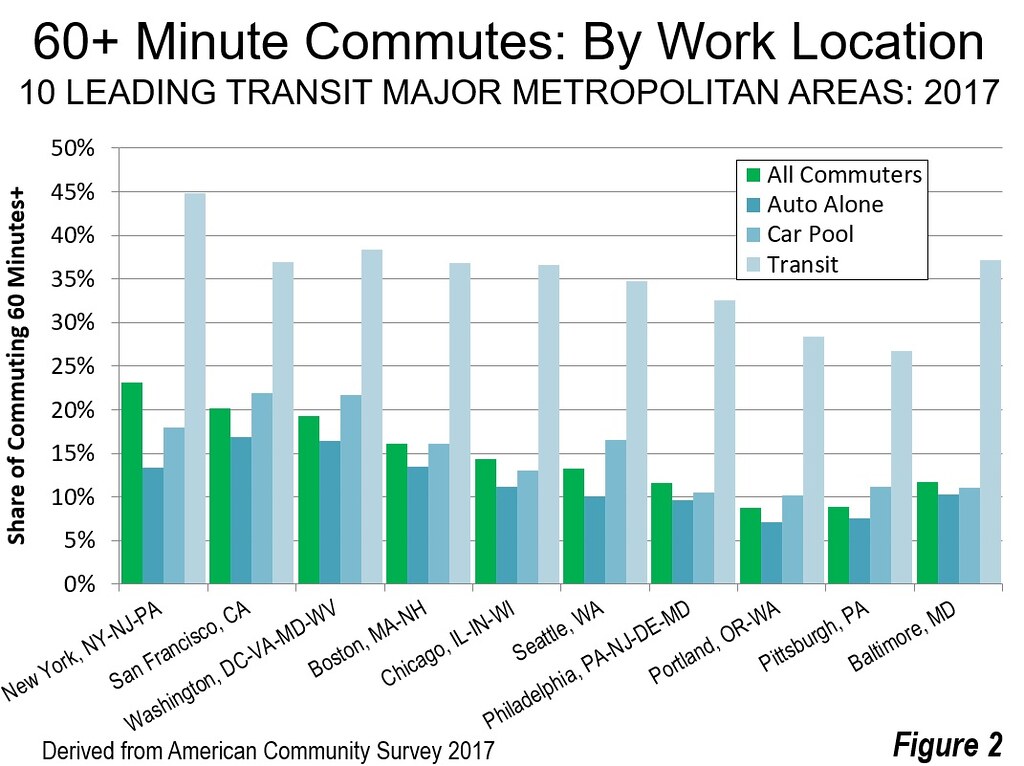
Solo drivers are most likely to have long commutes in San Francisco (16.9 percent) and Washington (16.4) percent. In much larger New York only 13.4 percent of drivers have a long commute, slightly better than Boston (13.5 percent). The smallest long commute percentages are in Portland (7.1 percent) and Pittsburgh (7.5 percent), which also have the smallest populations among the 10 strongest transit metropolitan areas. Philadelphia, a strong transit city, has a comparatively low 9.7 percent share of solo drivers have a long commute.
The largest percentages of car pools with long commutes is also in San Francisco (22.0 percent) and Washington (21.7 percent). Portland (10.2 percent) and Philadelphia (10.7 percent) and Pittsburgh have the smallest share of car pool workers with long commutes.
New York has by far the largest share of long commutes by transit, at 44.9 percent of transit commuters. San Francisco, Washington, Chicago, Boston and Baltimore have between 35 percent and 40 percent of transit commuters travel 60 or more minutes each way to work. Again, the smallest share of long commutes by transit are in Pittsburgh (26.8 percent) and Portland (28.4 percent).
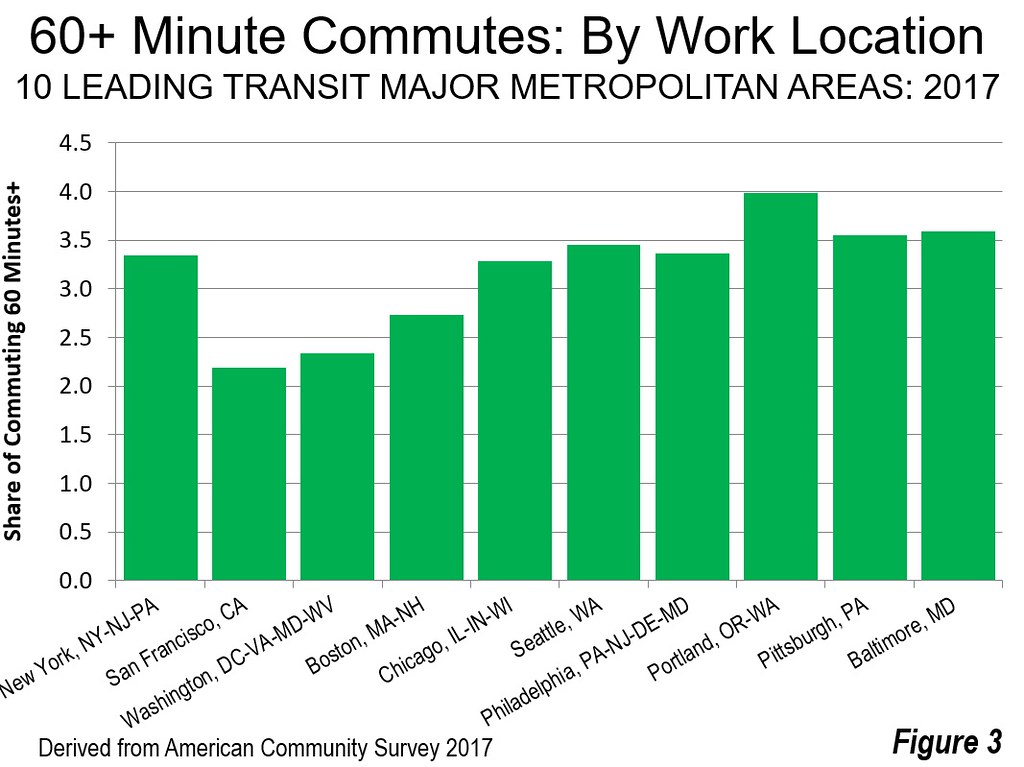
The larger percentage of long commutes by transit is compared to those of solo drivers in Figure 3. There is considerable variation. In San Francisco, the share of long commutes among transit riders is 2.2 times that of solo drivers, and 2.3 times in Washington. In Boston transit riders are 2.7 times as likely to have long commutes as solo drivers. In Chicago and New York, transit riders are 3.3 times as likely to have long commutes as solo drivers. Portland has the largest share of transit riders with a long commute compared to solo drivers, at 4.0.
All Major Metropolitan Areas and Los Angeles
The table below provides the long commute data for all 53 major metropolitan areas. Overall, New York has the largest long commute share, while Rochester has the smallest. Among solo drivers as well as those commuting by car pool, San Francisco has the largest long commute share, while Las Vegas has the smallest. San Jose has the largest share of transit long commutes, which at 54 percent is the result of Silicon Valley’s draw of commuters from well outside the metropolitan area, in adjacent San Francisco (and Stockton, not a major metropolitan area). The smallest share of long commutes in transit is in Hartford.
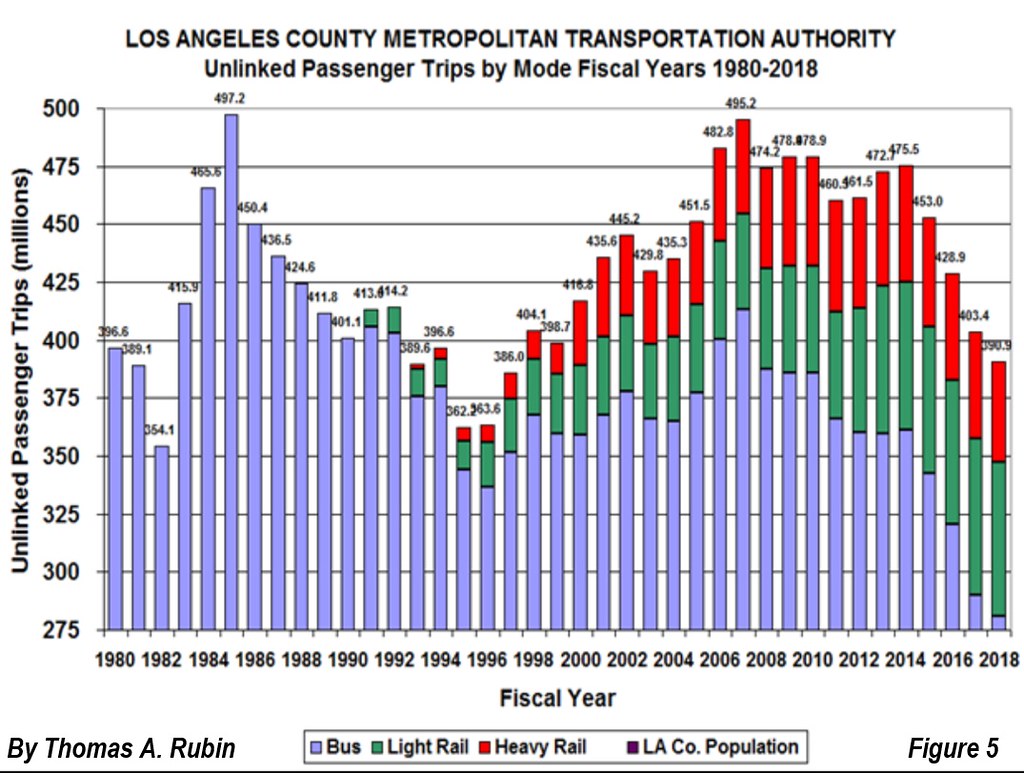
Perhaps surprisingly, the nation’s second largest metropolitan area, Los Angeles, ranks 12th in transit work trip market share. Long fabled for its intense traffic congestion, 15.4 percent of solo drivers in Los Angeles have long commutes, a lower proportion than in New York, San Francisco, Washington, Boston and San Jose. About 2.8 times as many transit commuters proportionally have long commutes than solo drivers. This is despite having spent nearly $20 billion (not inflation adjusted) on urban rail and busway construction through 2016, according to former SCRTD (now MTA) transit system Comptroller Thomas A. Rubin, with ridership reduced by more than one-fifth since 1985, just a few years before the first rail line opened (Figure 5, Courtesy of Thomas A. Rubin). The actual decline is doubtlessly greater because the addition of the rail system increased the number of transfers (see: “Just how much has Los Angeles transit ridership fallen,” particularly Figure 1).
Explaining the Disconnect
The longer travel times on transit do much to explain the “disconnect” that The Onion article seems to imply. Yes, people like transit, but avoid it largely because of its slow travel time. There are, of course, exceptions, where transit competes very well with solo driving, such as to the cores of the legacy cities, New York, Chicago, Philadelphia, San Francisco, Boston and Washington. But overall far fewer people can reach work in 30 minutes by transit as by driving. Access is the real barrier. On average workers in the major metropolitan areas can reach more than 55 times as many jobs by car as by transit in 30 minutes. Even in New York, with its world-class transit system, autos provide access to six times as many jobs as by transit. The Onion got it right.
| Long Commutes (60 Minutes Y Over) by Mode (Share of Modal Commutes) | |||||
| Metropolitan Area | Transit Share | All | Solo Driver | Car Pool | Transit |
| Atlanta, GA | 3.3% | 14.8% | 13.8% | 15.8% | 44.1% |
| Austin, TX | 2.0% | 8.6% | 7.8% | 13.8% | 21.3% |
| Baltimore, MD | 5.8% | 11.7% | 10.3% | 11.0% | 37.1% |
| Birmingham, AL | 0.8% | 7.8% | 7.5% | 10.5% | 20.9% |
| Boston, MA-NH | 13.8% | 16.1% | 13.5% | 16.1% | 36.8% |
| Buffalo, NY | 3.4% | 3.7% | 2.8% | 4.0% | 25.1% |
| Charlotte, NC-SC | 1.6% | 7.6% | 6.8% | 10.0% | 36.9% |
| Chicago, IL-IN-WI | 12.8% | 14.4% | 11.2% | 13.0% | 36.7% |
| Cincinnati, OH-KY-IN | 1.9% | 5.7% | 5.1% | 8.0% | 22.6% |
| Cleveland, OH | 2.7% | 5.2% | 4.3% | 5.6% | 34.3% |
| Columbus, OH | 1.5% | 5.5% | 5.0% | 7.4% | 32.1% |
| Dallas-Fort Worth, TX | 1.4% | 9.9% | 9.0% | 12.3% | 43.6% |
| Denver, CO | 4.8% | 8.4% | 6.9% | 9.9% | 31.8% |
| Detroit, MI | 1.3% | 7.9% | 7.3% | 8.7% | 41.7% |
| Grand Rapids, MI | 1.2% | 4.1% | 3.7% | 5.0% | 29.5% |
| Hartford, CT | 2.8% | 5.6% | 5.2% | 6.2% | 17.8% |
| Houston, TX | 2.2% | 11.3% | 10.5% | 12.0% | 40.5% |
| Indianapolis. IN | 1.0% | 6.0% | 5.7% | 6.2% | 27.9% |
| Jacksonville, FL | 1.1% | 6.1% | 5.7% | 4.9% | 38.1% |
| Kansas City, MO-KS | 0.8% | 4.1% | 3.8% | 5.2% | 20.0% |
| Las Vegas, NV | 3.3% | 4.0% | 2.1% | 3.0% | 49.0% |
| Los Angeles, CA | 5.0% | 15.4% | 13.9% | 17.9% | 42.6% |
| Louisville, KY-IN | 2.0% | 5.4% | 4.5% | 6.4% | 26.0% |
| Memphis, TN-MS-AR | 0.7% | 4.8% | 4.4% | 5.7% | 29.5% |
| Miami, FL | 3.3% | 10.7% | 9.5% | 11.8% | 41.5% |
| Milwaukee,WI | 3.1% | 4.7% | 3.8% | 4.1% | 31.0% |
| Minneapolis-St. Paul, MN-WI | 5.1% | 6.3% | 5.2% | 8.2% | 23.0% |
| Nashville, TN | 1.0% | 10.6% | 10.0% | 14.0% | 30.5% |
| New Orleans. LA | 2.2% | 9.7% | 8.7% | 13.1% | 33.9% |
| New York, NY-NJ-PA | 32.5% | 23.2% | 13.4% | 18.0% | 44.9% |
| Oklahoma City, OK | 0.5% | 4.2% | 4.1% | 4.4% | 29.8% |
| Orlando, FL | 1.8% | 8.6% | 7.9% | 8.6% | 42.0% |
| Philadelphia, PA-NJ-DE-MD | 9.4% | 11.6% | 9.7% | 10.5% | 32.6% |
| Phoenix, AZ | 2.0% | 7.2% | 6.0% | 9.9% | 40.1% |
| Pittsburgh, PA | 5.8% | 8.9% | 7.5% | 11.1% | 26.8% |
| Portland, OR-WA | 6.8% | 8.8% | 7.1% | 10.2% | 28.4% |
| Providence, RI-MA | 1.4% | 5.8% | 5.0% | 10.0% | 36.1% |
| Raleigh, NC | 0.8% | 7.0% | 6.5% | 8.9% | 36.2% |
| Richmond, VA | 1.3% | 5.6% | 4.8% | 10.6% | 22.5% |
| Riverside-San Bernardino, CA | 1.0% | 9.9% | 8.9% | 16.0% | 33.1% |
| Rochester, NY | 1.8% | 3.6% | 3.2% | 4.0% | 25.5% |
| Sacramento, CA | 2.5% | 8.0% | 7.0% | 11.2% | 31.9% |
| St. Louis,, MO-IL | 2.5% | 6.2% | 5.2% | 7.7% | 38.2% |
| Salt Lake City, UT | 3.9% | 5.3% | 3.6% | 6.0% | 37.4% |
| San Antonio, TX | 1.9% | 6.4% | 5.3% | 8.7% | 41.4% |
| San Diego, CA | 3.2% | 8.5% | 7.4% | 10.9% | 35.0% |
| San Francisco, CA | 17.9% | 20.2% | 16.9% | 22.0% | 36.9% |
| San Jose, CA | 5.6% | 16.0% | 13.3% | 19.4% | 54.1% |
| Seattle, WA | 10.8% | 13.3% | 10.1% | 16.5% | 34.8% |
| Tampa-St. Petersburg, FL | 1.3% | 8.7% | 8.0% | 10.4% | 42.3% |
| Tucson, AZ | 2.3% | 4.7% | 3.4% | 7.7% | 37.4% |
| Virginia Beach-Norfolk, VA-NC | 1.6% | 6.2% | 5.6% | 8.6% | 38.2% |
| Washington, DC-VA-MD-WV | 13.8% | 19.3% | 16.4% | 21.7% | 38.4% |
| Derived from American Community Survey | |||||
Wendell Cox is principal of Demographia, an international public policy and demographics firm. He is a Senior Fellow of the Center for Opportunity Urbanism (US), Senior Fellow for Housing Affordability and Municipal Policy for the Frontier Centre for Public Policy (Canada), and a member of the Board of Advisors of the Center for Demographics and Policy at Chapman University (California). He was appointed to three terms on the Los Angeles County Transportation Commission, where he served with the leading city and county leadership as the only non-elected member. During that time, he authored the amendment that created the Proposition A 35% set aside that established the first local funding for the rail system. His involvement on the Commission is detailed in Transit in Los Angeles.
Photograph: Katy Freeway (Interstate 10), Houston
https://en.wikipedia.org/wiki/Interstate_10_in_Texas#/media/File:RF_-_Ho...


