
After China’s Guangzhou-Hong Kong adjacent urban areas in the Pearl River Delta (see: “Ultimate City: The Guangdong-Hong Kong-Macao Greater Bay Area”), the second most expansive urbanization in the world stretches from Shanghai to Changzhou in China. The seven adjacent urban areas (Note), Shanghai, Kunshan, Suzhou, Changshu, Wuxi, Zhangjiagang and Changzhou have an estimated population of 39.5 million, stretching approximately 250 kilometers (150 miles) from Pudong International Airport in Shanghai’s eastern suburbs to western Changzhou.
This article is a part of the “Evolving Urban Form" series and provides summary information on the Shanghai to Changzhou adjacent urban areas in the Yangtze River Delta. There is also a photographic tour, following the text comprised of Figures 8-29. Population and urban land area data is derived from the 2019 edition of Demographia World Urban Areas.
Geography of the Shanghai to Changzhou Adjacent Urban Areas
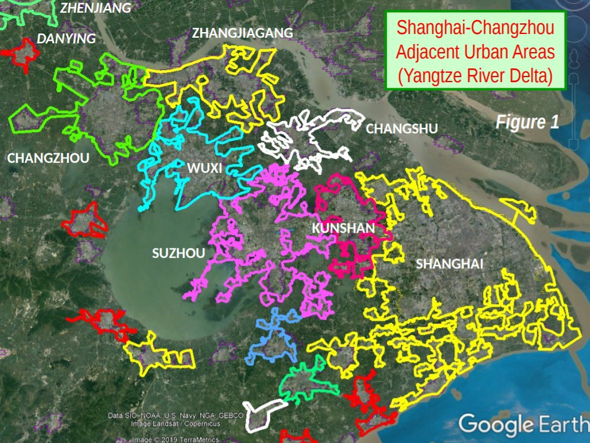
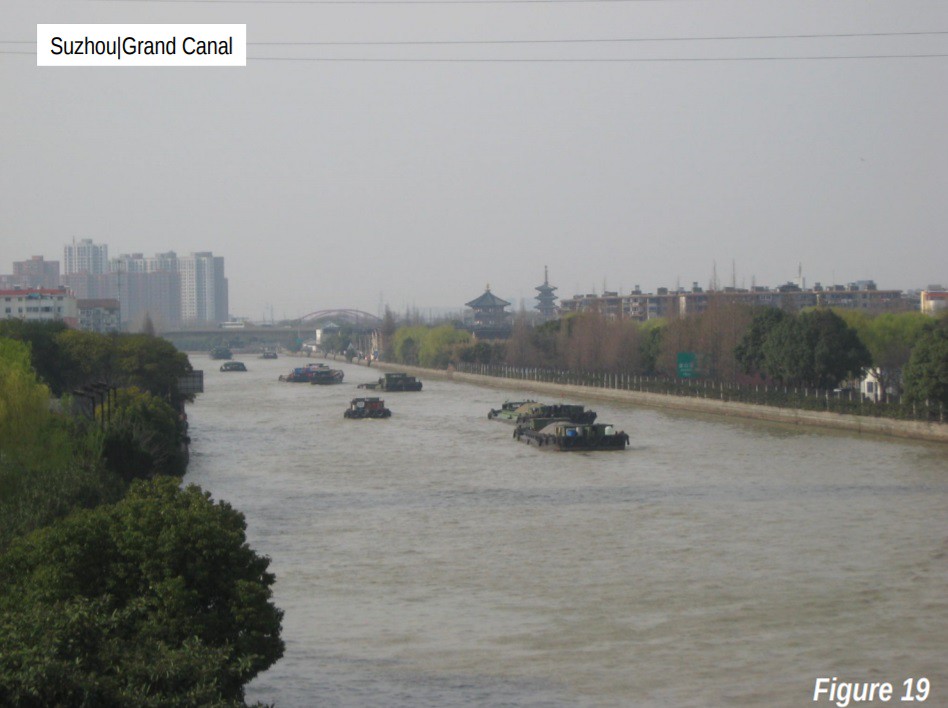
The Shanghai-Changzhou urbanization is located within four municipalities in a line from east to west (Shanghai, Suzhou, Wuxi and Changzhou). The eastern boundary of Shanghai is the Pacific Ocean, at the mouth of the Yangtze River, China’s longest (locally called “Chang Jiang” which translates into “long river"). At 6,300 kilometers (3,900 miles), the Yangtze is the third longest in the world. Each of the four municipalities is bounded on the north by Yangtze River. Suzhou is famous for its canals and has been referred to as the “Venice of the East,” with 40 percent of the municipal area along water. The Grand Canal, the world’s largest, which was built between Hangzhou and Beijing nearly 1,500 years ago. The Grand Canal is 1,800 kilometers long (1,100 miles). The Grand Canal bisects Suzhou (Figure 19), Wuxi (Figure 26) and Changzhou before crossing the Yangtze River (see map).
The continuous urbanization is interrupted by only about 10 kilometers (6 miles) between Changzhou and the Danyang urban area, another 6 non-urban kilometers (4 miles) to the Zhenjiang urban area (home of the Pearl S. Buck Museum) and then 13 kilometers (8 miles) to the Nanjing urban area. About 90 percent of a train ride of 300 kilometers (190 kilometers) between Shanghai station and Nanjing station is in urbanization.
The Shanghai urban area has small extensions into the adjacent provinces of Jiangsu (JS) and Zhejiang (ZJ). All of the other six urban areas in Shanghai-Changzhou are within the province of Jiangsu. The Suzhou urban area is in Suzhou municipality, along with the Changshu urban area. The Zhangjiagang urban area is centered in Suzhou municipality, and extends into the Wuxi municipality. The Wuxi urban area is all in the Wuxi municipality and the Changzhou urban area is all in the Changzhou municipality (Figure 1).
Shanghai-Changzhou: Population and Density
The Shanghai-Changzhou adjacent urban areas has one-third fewer residents than the Guangzhou-Hong Kong urbanization, with its nearly 56 million residents. Shanghai-Changzhou remains slightly larger than the Tokyo-Yokohama urban area, with its 38.5 million residents and the Jakarta urban area, with its 34.4 million residents (Figure 2).

The population density of Shanghai-Changzhou is 4,400 per square kilometer (11,400 per square mile), below the 6,100 per square kilometer (15,800 per square mile) of Guangzhou-Hong Kong. Shanghai-Changzhou is less dense than most of the urban expanses in the developing world, considerably less dense than Mumbai (itself, barely two-thirds as dense as Dhaka, the densest major urban area in the world). At the same time, Shanghai-Changzhou is nearly three times as dense as the New York urban area, which covers the most land area of any urban area in the world (Figure 3).

Spectacular Growth Since 1980
Shanghai–Changzhou has experienced spectacular population growth, gaining approximately 400 percent from 1980 to 2019. Figure 4 illustrates the population trend in among the contiguous urbanization with more than 20 million residents (Beijing does not reach the threshold). Despite the strong growth in Shanghai-Changzhou, Guangzhou-Hong Kong has grown even faster, adding about 500 percent to its 1980 population. Even so, Shanghai-Changzhou has added population at about the same rate as fast growing Jakarta and Delhi (the second and third largest urban areas in the world). By comparison, Sao Paulo and Mexico City, which were among the fastest growing urban areas in the world in the second half of the 20th century, grew between 50 and 75 percent. Growth was even slower in the high-income urban areas of Tokyo (35 percent) and New York (less than 25 percent). (Figure 4).

Population Distribution and Growth in Shanghai-Changzhou
The Shanghai urban area dominates Shanghai-Changzhou, both in population and population growth (Figure 5). About 56 percent of the area’s population is in Shanghai, which has captured more than 50 percent of the population growth since 1980 (Figures 6 and 7). There continues to be population pressure, both from migration from elsewhere in China and by temporary residents seeking to obtain permanent resident (hukou) status. However, Shanghai has stopped growing, in response to the municipality’s population limitation strategies. As a result, virtually all of the population growth in Shanghai-Changzhou seems likely to occur outside Shanghai. This could also lead to higher growth in the balance of the much larger Yangtze River Delta, which is described below. The other six urban areas have grown spectacularly as well, largely erasing the open areas that existed between them as recently as 1980.


Building Boom
Perhaps the most impressive new commercial center in China is Shanghai’s Lujiazui business district in Pudong (Figure 8, from The Bund, from across the Huang Pu). Lujiazui is across the river from Puxi, the historic central business district of Shanghai. Lujiazui is one of the world’s largest edge cities and has had spectacular high rise development.
The Jin Mao Tower, was completed in 1999 and stood for a while the world’s fourth tallest building (450 meters/1.476 feet) and tallest building in China, according to the Council on Tall Buildings and Urban Habitat. At that time, the Jin Mao Tower trailed only the Sears Tower (Willis Tower) in Chicago and the two Petronas Towers in Kuala Lumpur, which had been built in 1998. With the rapid increase in super-tall buildings in China, the Middle East and elsewhere, today the Jin Mao Tower is 23rd tallest in the world.
In fact, Jin Mao is not even the tallest building in its neighborhood since two even taller buildings have been constructed, virtually across the street (Photograph at the top). The Shanghai World Financial Center (to the right) was opened in 2008 and is now the world’s 10th tallest building (492 meters/1,614 feet). The tallest of the three buildings is the Shanghai Tower (632 meters/2,073 feet), opened in 2015 (to the left). The Jin Mao Tower is in the center. There is no similar concentration of tall buildings in the world.
This year, the Suzhou IFS Tower is opening (450 meters/1.476 feet), crowning the Culture Center-Times Square edge city. At the next closest subway stop toward central Suzhou is the Gate to the East, which preceded the IFS Tower as the tallest building in outside Shanghai in the adjacent urban areas (302 meters/990 feet).
The Yangtze River Delta Cluster
Shanghai-Changzhou is at the heart of the Yangtze River Delta “cluster,” one of the three original super-city clusters designated in 2010 by China’s central government for initiatives toward greater economic integration.
With 152 million residents, the Yangtze River Delta is larger than the Pearl River Delta cluster (60 million), with its Guangzhou-Hong Kong adjacent urban areas and Jing-Jin-Ji, centered on Beijing, Tianjin and Hebei province (112 million).
Beyond Shanghai-Changzhou, the Yangtze River Delta cluster includes the Hangzhou-Shaoxing adjacent urban area (population nearly 10 million), as well as major urban areas such as Ningbo, Zhoushan, Zhenjiang, Nanjing and Hefei (more than 500 kilometers [300 miles] from Shanghai’s Pudong International Airport).
The list of super-city clusters has now been increased to 19. HSBC Chief China Economist Qu Hongbin estimates that these clusters will be responsible for 80 percent of China’s economic production by 2030. An Economist map of the 19 super-city clusters can be viewed here.
Prospects for Further Growth
The adjacent urban areas of Shanghai-Changzhou seem likely to retain their position as the second largest expanse of urbanization in the world, at least for the next few years. Guangzhou-Hong Kong continues to grow considerably faster and is likely to remain easily the largest urbanization in the world. However, population growth has slowed considerably in eastern China’s largest urban areas, while some interior urban areas are growing more quickly. Despite Shanghai’s population control Shanghai-Changzhou should continue to widen the gap with Tokyo, though at present rates of growth, it still could be challenged by upstarts Jakarta and Delhi by the mid-2030s.
Note: The adjacent urban areas are not combined, due to the absence of information on commuting, which largely defines urban labor markets (see Alain Bertaud, Order without Design: How Markets Shape Cities). For example, the United Nations, which relies upon national governments for its urban area data, considers each of the urban areas in Shanghai-Changzhou as separate, rather than combining any (as does Demographia World Urban Areas).
PHOTOGRAPHIC TOUR OF THE SHANGHAI-CHANGZHOU
Figures 8-17: Shanghai urban area
8: Lujiazui (Pudong) from the Bund
9: The Bund to the north (Peace Hotel and Bank of China)
10: The Bund to the south (domed Shanghai-Pudong Development Bank [former HSBC] and Customs House
11-13: Lujiazui (Pudong)
14: China Pavilion, 2010 World’s Fair Site
15: Street, former French concession
16: Neighborhood near Yuyuan Garden
17: Suburbs, landing at Pudong International Airport
Figure 18: Kunshan urban area (Suzhou municipality)
Figures 19-25 Suzhou urban area
19: Grand Canal
20-21: Local Canals
22: Tiger Hill Pagoda
23: Humble Administrator’s Garden
24: Suzhou IFC Tower, Cultural Center-Times Square
25: Gateway to the East, Suzhou Center
Figures 26-27 Wuxi urban area
26: Grand Canal
27: Condominium development
Figures 28-29: Changzhou urban area


Wendell Cox is principal of Demographia, an international public policy and demographics firm. He is a Senior Fellow of the Center for Opportunity Urbanism (US), Senior Fellow for Housing Affordability and Municipal Policy for the Frontier Centre for Public Policy (Canada), and a member of the Board of Advisors of the Center for Demographics and Policy at Chapman University (California). He is co-author of the "Demographia International Housing Affordability Survey" and author of "Demographia World Urban Areas" and "War on the Dream: How Anti-Sprawl Policy Threatens the Quality of Life." He was appointed by Mayor Tom Bradley to three terms on the Los Angeles County Transportation Commission, where he served with the leading city and county leadership as the only non-elected member. Speaker of the House of Representatives appointed him to the Amtrak Reform Council. He served as a visiting professor at the Conservatoire National des Arts et Metiers, a national university in Paris.
Photograph: Shanghai’s 3 tallest buildings concentrated in three adjacent blocks (Left: Shanghai Tower, Center: Jin Mao Tower, Right: Shanghai World Financial Center).


#/media/File:Grand-Canal.png)