The years to come seem likely to see America’s historic population dispersion continue or accelerate, as pandemic and lockdown worries have severely reduced the attractiveness of dense urban cores (especially in the highest density areas, such as New York City). As a result, the sparsely populated outer areas of combined statistical areas (CSAs), the largest category of local labor market defined by the Office of Management and Budget (OMB), could be the destination of many former urban core households.
This article examines the 105 largest labor markets (CSAs and uncombined metropolitan areas) with more than 500,000 population, as of 2019.
Labor Markets (Statistical Areas)
Collectively, OMB labor markets are called “statistical areas.” They are defined in their entirety by whole counties and by commuting patterns between those counties. CSAs have received considerably less attention in the media than metropolitan and micropolitan areas. Since the early 2000s redefinition of metropolitan areas, “combined statistical areas” (CSAs) have received considerably less attention than the geographically smaller metropolitan and micropolitan areas (a more complete description is the Labor Market Note).
These 105 CSA/MSAs had 257 million residents, more than three-quarters (78%) of the nation’s 328 million residents in 2019.
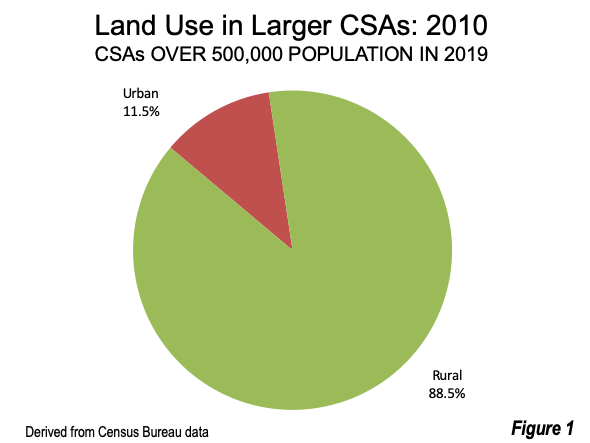
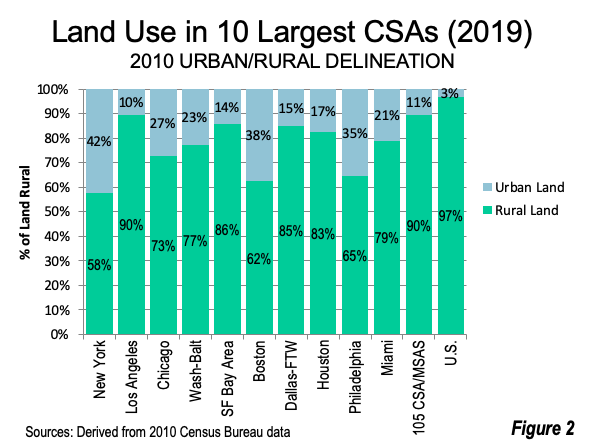
While CSA/MSAs have much of the nation’s population, they are far more rural than urban. All of the largest 105 have more rural than urban land (developed or built-up urban land). According to 2010 Census data, Overall, CSA/MSAs were 89.5% rural and only 11.5% urban (Figure 1). The rural and urban land is shown for the 10 largest CSAs in Figure 2. By comparison, 97% of the nation’s land area was rural and only 3.0% urban, according to the 2010 Census.


Only seven CSA/MSAs have more than 30% urban land. These include Tampa-St. Petersburg (45%), New York (42%), Boston (38%), Hartford (37%), Honolulu (36%), Philadelphia (35%), Detroit (31%). The two CSAs with the smallest urban land area are Boise (1%) and Las Vegas (2%).
The 105 largest CSA/MSAs are shown in the Table at the end of the article, along with their populations and the extent of their rural land areas. The two largest CSA’s are above the 10 million criteria that defines megacities (New York and Los Angeles).
The New York CSA continues to be the largest. With 22.6 million residents, the New York CSA includes not only the New York MSA, but another seven metropolitan areas, extending more than 200 miles both north to south and east to west. Its 12,400 square mile land area is greater than that of 9 states.
Los Angeles is the second largest CSA, with 18.7 million residents. Its 34,000 square miles is nearly as large as Indiana. Yet, only 10% of its land area is urban.
Chicago ranks third, with 9.8 million residents. However, it is experiencing modest population losses and may not ever achieve megacity status unless further dispersion of commuting patterns includes additional counties in the CSA. The Chicago CSA has 27% of its land in urban uses.
The Washington-Baltimore CSA is the fourth largest, also with 9.8 million residents. At its present population growth rate, Washington-Baltimore should reach 10 million residents in the next five years. Approximately 23% of its land is urban.
The San Jose-San Francisco (Bay Area) CSA includes the San Jose MSA and the San Francisco MSA as well as seven additional smaller metropolitan areas. The Bay Area MSA stretches more than 200 miles north to south. Only 14% of the Bay Area CSA land is urban. Like Washington-Baltimore the Bay Area CSA should reach 10 million residents in the next five years.
CSAs: An Opportunity for Lower Density Living
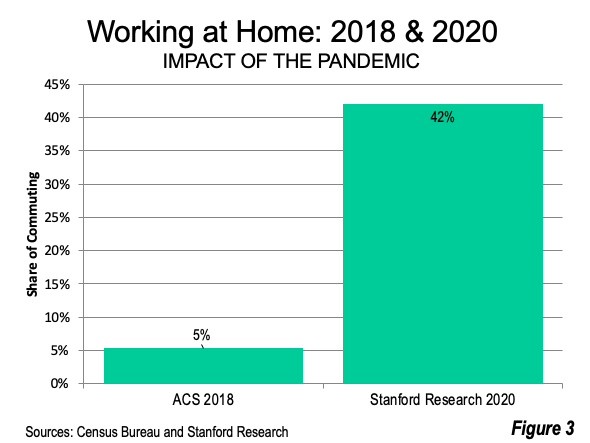
Commuting patterns have changed considerably in response to efforts to control the spread of the COVID-19 virus. Stanford University research indicates that 42% of the workforce is now working from home, generally working on-line and participating in work activities by on-line meetings (such as “Zoom”). This is eight times the number of workers who reported working at home as their principal commuting mode in the 2018 American Community Survey (Figure 3).

In the COVID-19 world and beyond, CSAs are likely to become more important. With the lockdowns of employment locations, millions of employees and many companies have found that employees can be at least as productive working on-line from home. Low density housing is now in much greater demand, as households seek to move away from denser areas, which have endured far more than their share of COVID-19 fatalities.
This has opened up a choice that many had not previously considered — telecommuting or commuting to work less frequently, perhaps once a week or even less frequent. A number of companies have taken steps to allow their employees to work at home.
The change in demand is obvious in the nation’s largest labor market, and the one with by far the highest urban core population and employment densities, New York. In such density, normal life and the economy are not sustainable with the social distancing and other policies necessary to control a pandemic that is spread person to person.
A “real estate frenzy” has been noted in Connecticut, New Jersey, Westchester County and Long Island, as City residents seek to move to where there is more space and less danger of infection. These areas could become prime attractors of Manhattan employees who want to avoid the crowded offices, crowded transit, crowded elevators and generally overcrowded situations that naturally accompany super-high population and employment densities. For these, an occasional train ride to Manhattan from Connecticut or New Jersey would make it possible to retain access to the City, while working principally from home offices in view of leafy lawns.
Similar choices would be available to people who work in other large metropolitan areas. For example, a Denver MSA worker can live and work from home in the CSA, whether in a small town, or even in the Rocky Mountains, and still be close enough to work in the office when necessary.
Workers can also live wherever they want and connect to work on-line virtually anywhere. A worker relocating to North Carolina’s western Appalachians could telecommute to Atlanta, Austin or any number of other places. Workers could to live near family, whether or not in scenic areas, and have virtually the same telecommuting opportunities.
CSAs: The Telecommuting Advantages
CSA/MSAs are well positioned to serve the needs of the next wave of migrants from density to dispersion. Not only do they have vast amounts of rural land, but they also have low urban population densities. Among the 98 CSA/MSAs with more than a single county, 94 of 100 have urban densities of less than 2,500 per square mile.
Counties in this urban density range have more than 60% of the nation’s population, yet have wide expanses of land. Already the nation’s urban cores have only a small minority of the population. In the 53 metropolitan areas with more than 1,000,000 population, less than 15% of the population lives in urban cores based on 2014-2018 data (generally at population densities above 7,500).
The nation has plenty of room to accommodate households looking for sufficient space to minimize infections and reduce the economic consequences not only of this continuing pandemic, but also any that yet may come.
Note on Labor Markets: The Office of Management and Budget has three statistical area classifications, combined statistical areas, metropolitan statistical areas and micropolitan statistical areas. Metropolitan and micropolitan areas are collectively called “core based statistical areas” (CBSA), named for the urban cores (urban areas) around which they are organized. The following descriptions are from the Office of Management and Budget.
Metropolitan and Micropolitan Statistical Areas: Metropolitan Statistical Areas have at least one urbanized area of 50,000 or more population, plus adjacent territory that has a high degree of social and economic integration with the core as measured by commuting ties. Micropolitan Statistical Areas – a new set of statistical areas – have at least one urban cluster of at least 10,000 but less than 50,000 population, plus adjacent territory that has a high degree of social and economic integration with the core as measured by commuting ties.
Combined Statistical Areas: If specified criteria are met, adjacent Metropolitan and Micropolitan Statistical Areas, in various combinations, may become the components of a new set of complementary areas called Combined Statistical Areas. For instance, a Combined Statistical Area may comprise two or more Metropolitan Statistical Areas, a Metropolitan Statistical Area and a Micropolitan Statistical Area, two or more Micropolitan Statistical Areas, or multiple Metropolitan and Micropolitan Statistical Areas that have social and economic ties as measured by commuting but at lower levels than are found among counties within Metropolitan and Micropolitan Statistical Areas.
105 CSA/MSAs Over 500,000 (2019) |
|||
| (In Millions) | |||
| CSA/MSA | 2019 Population (Millions) |
Rural Share of Land Area |
|
| 1 | New York-Newark, NY-NJ-CT-PA CSA | 22.589 | 58% |
| 2 | Los Angeles-Long Beach, CA CSA | 18.711 | 90% |
| 3 | Chicago-Naperville, IL-IN-WI CSA | 9.825 | 73% |
| 4 | Washington-Baltimore-Arlington, DC-MD-VA-WV-PA CSA | 9.815 | 77% |
| 5 | San Jose-San Francisco-Oakland, CA CSA | 9.666 | 86% |
| 6 | Boston-Worcester-Providence, MA-RI-NH-CT CSA | 8.288 | 62% |
| 7 | Dallas-Fort Worth, TX-OK CSA | 8.058 | 85% |
| 8 | Houston-The Woodlands, TX CSA | 7.253 | 83% |
| 9 | Philadelphia-Reading-Camden, PA-NJ-DE-MD CSA | 7.210 | 65% |
| 10 | Miami-Port St. Lucie-Fort Lauderdale, FL CSA | 6.890 | 79% |
| 11 | Atlanta--Athens-Clarke County--Sandy Springs, GA-AL CSA | 6.853 | 75% |
| 12 | Detroit-Warren-Ann Arbor, MI CSA | 5.342 | 69% |
| 13 | Phoenix-Mesa, AZ CSA | 5.002 | 93% |
| 14 | Seattle-Tacoma, WA CSA | 4.904 | 88% |
| 15 | Orlando-Lakeland-Deltona, FL CSA | 4.161 | 81% |
| 16 | Minneapolis-St. Paul, MN-WI CSA | 4.028 | 88% |
| 17 | Denver-Aurora, CO CSA | 3.618 | 93% |
| 18 | Cleveland-Akron-Canton, OH CSA | 3.587 | 76% |
| 19 | San Diego-Chula Vista-Carlsbad, CA MSA | 3.338 | 82% |
| 20 | Portland-Vancouver-Salem, OR-WA CSA | 3.260 | 94% |
| 21 | Tampa-St. Petersburg-Clearwater, FL MSA | 3.195 | 55% |
| 22 | St. Louis-St. Charles-Farmington, MO-IL CSA | 2.908 | 87% |
| 23 | Charlotte-Concord, NC-SC CSA | 2.798 | 80% |
| 24 | Salt Lake City-Provo-Orem, UT CSA | 2.641 | 97% |
| 25 | Sacramento-Roseville, CA CSA | 2.639 | 91% |
| 26 | Pittsburgh-New Castle-Weirton, PA-OH-WV CSA | 2.603 | 84% |
| 27 | San Antonio-New Braunfels-Pearsall, TX CSA | 2.571 | 92% |
| 28 | Columbus-Marion-Zanesville, OH CSA | 2.526 | 91% |
| 29 | Kansas City-Overland Park-Kansas City, MO-KS CSA | 2.501 | 92% |
| 30 | Indianapolis-Carmel-Muncie, IN CSA | 2.457 | 87% |
| 31 | Las Vegas-Henderson, NV CSA | 2.313 | 98% |
| 32 | Cincinnati-Wilmington-Maysville, OH-KY-IN CSA | 2.280 | 82% |
| 33 | Austin-Round Rock-Georgetown, TX MSA | 2.227 | 86% |
| 34 | Raleigh-Durham-Cary, NC CSA | 2.080 | 82% |
| 35 | Nashville-Davidson--Murfreesboro, TN CSA | 2.063 | 89% |
| 36 | Milwaukee-Racine-Waukesha, WI CSA | 2.048 | 80% |
| 37 | Virginia Beach-Norfolk, VA-NC CSA | 1.859 | 85% |
| 38 | Greensboro--Winston-Salem--High Point, NC CSA | 1.689 | 84% |
| 39 | Jacksonville-St. Marys-Palatka, FL-GA CSA | 1.689 | 84% |
| 40 | New Orleans-Metairie-Hammond, LA-MS CSA | 1.507 | 91% |
| 41 | Louisville/Jefferson County--Elizabethtown--Bardstown, KY-IN CSA | 1.489 | 88% |
| 42 | Oklahoma City-Shawnee, OK CSA | 1.482 | 92% |
| 43 | Greenville-Spartanburg-Anderson, SC CSA | 1.475 | 85% |
| 44 | Hartford-East Hartford, CT CSA | 1.470 | 63% |
| 45 | Grand Rapids-Kentwood-Muskegon, MI CSA | 1.412 | 88% |
| 46 | Memphis-Forrest City, TN-MS-AR CSA | 1.371 | 89% |
| 47 | Birmingham-Hoover-Talladega, AL CSA | 1.318 | 90% |
| 48 | Fresno-Madera-Hanford, CA CSA | 1.309 | 97% |
| 49 | Richmond, VA MSA | 1.292 | 89% |
| 50 | Harrisburg-York-Lebanon, PA CSA | 1.272 | 85% |
| 51 | Buffalo-Cheektowaga-Olean, NY CSA | 1.204 | 85% |
| 52 | Cape Coral-Fort Myers-Naples, FL CSA | 1.198 | 86% |
| 53 | Albany-Schenectady, NY CSA | 1.168 | 93% |
| 54 | Rochester-Batavia-Seneca Falls, NY CSA | 1.161 | 90% |
| 55 | Albuquerque-Santa Fe-Las Vegas, NM CSA | 1.158 | 98% |
| 56 | Knoxville-Morristown-Sevierville, TN CSA | 1.146 | 88% |
| 57 | Tulsa-Muskogee-Bartlesville, OK CSA | 1.118 | 94% |
| 58 | Tucson-Nogales, AZ CSA | 1.094 | 96% |
| 59 | Dayton-Springfield-Kettering, OH CSA | 1.080 | 86% |
| 60 | North Port-Sarasota, FL CSA | 1.064 | 83% |
| 61 | El Paso-Las Cruces, TX-NM CSA | 1.062 | 97% |
| 62 | Chattanooga-Cleveland-Dalton, TN-GA CSA | 1.005 | 89% |
| 63 | Omaha-Council Bluffs-Fremont, NE-IA CSA | 0.986 | 94% |
| 64 | Honolulu MSA | 0.975 | 64% |
| 65 | Columbia-Orangeburg-Newberry, SC CSA | 0.963 | 92% |
| 66 | McAllen-Edinburg, TX CSA | 0.933 | 86% |
| 67 | Little Rock-North Little Rock, AR CSA | 0.909 | 95% |
| 68 | Bakersfield, CA MSA | 0.900 | 97% |
| 69 | Madison-Janesville-Beloit, WI CSA | 0.893 | 95% |
| 70 | Des Moines-Ames-West Des Moines, IA CSA | 0.878 | 95% |
| 71 | Baton Rouge, LA MSA | 0.855 | 91% |
| 72 | Fayetteville-Sanford-Lumberton, NC CSA | 0.855 | 90% |
| 73 | Allentown-Bethlehem-Easton, PA-NJ MSA | 0.844 | 76% |
| 74 | Toledo-Findlay-Tiffin, OH CSA | 0.831 | 90% |
| 75 | Boise City-Mountain Home-Ontario, ID-OR CSA | 0.831 | 99% |
| 76 | South Bend-Elkhart-Mishawaka, IN-MI CSA | 0.809 | 87% |
| 77 | Charleston-North Charleston, SC MSA | 0.802 | 89% |
| 78 | Charleston-Huntington-Ashland, WV-OH-KY CSA | 0.777 | 96% |
| 79 | Colorado Springs, CO MSA | 0.746 | 93% |
| 80 | Lexington-Fayette--Richmond--Frankfort, KY CSA | 0.745 | 93% |
| 81 | Spokane-Spokane Valley-Coeur d'Alene, WA-ID CSA | 0.734 | 96% |
| 82 | Syracuse-Auburn, NY CSA | 0.725 | 92% |
| 83 | Springfield, MA MSA | 0.697 | 84% |
| 84 | Wichita-Winfield, KS CSA | 0.675 | 95% |
| 85 | Jackson-Vicksburg-Brookhaven, MS CSA | 0.674 | 95% |
| 86 | Mobile-Daphne-Fairhope, AL CSA | 0.653 | 91% |
| 87 | Portland-Lewiston-South Portland, ME CSA | 0.647 | 91% |
| 88 | Fort Wayne-Huntington-Auburn, IN CSA | 0.640 | 92% |
| 89 | Reno-Carson City-Fernley, NV CSA | 0.638 | 98% |
| 90 | Youngstown-Warren, OH-PA CSA | 0.638 | 86% |
| 91 | Huntsville-Decatur, AL CSA | 0.624 | 88% |
| 92 | Lafayette-Opelousas-Morgan City, LA CSA | 0.621 | 94% |
| 93 | Augusta-Richmond County, GA-SC MSA | 0.609 | 92% |
| 94 | Palm Bay-Melbourne-Titusville, FL MSA | 0.602 | 74% |
| 95 | Savannah-Hinesville-Statesboro, GA CSA | 0.584 | 93% |
| 96 | Myrtle Beach-Conway, SC-NC CSA | 0.560 | 91% |
| 97 | Scranton--Wilkes-Barre, PA MSA | 0.554 | 88% |
| 98 | Lansing-East Lansing, MI MSA | 0.550 | 91% |
| 99 | Lancaster, PA MSA | 0.546 | 73% |
| 100 | Asheville-Marion-Brevard, NC CSA | 0.543 | 90% |
| 101 | Pensacola-Ferry Pass, FL-AL CSA | 0.539 | 89% |
| 102 | Corpus Christi-Kingsville-Alice, TX CSA | 0.535 | 97% |
| 103 | Fayetteville-Springdale-Rogers, AR MSA | 0.535 | 92% |
| 104 | Johnson City-Kingsport-Bristol, TN-VA CSA | 0.511 | 90% |
| 105 | Kalamazoo-Battle Creek-Portage, MI CSA | 0.504 | 90% |
| Source: Census Bureau | |||
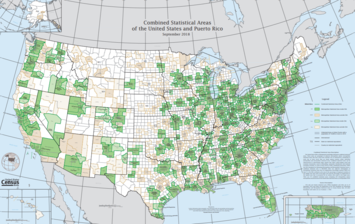
Photo: Census Bureau Combined Statistical Area map as of September 2018.
Wendell Cox is principal of Demographia, an international public policy firm located in the St. Louis metropolitan area. He is a founding senior fellow at the Urban Reform Institute, Houston and a member of the Advisory Board of the Center for Demographics and Policy at Chapman University in Orange, California. He has served as a visiting professor at the Conservatoire National des Arts et Metiers in Paris. His principal interests are economics, poverty alleviation, demographics, urban policy and transport. He is co-author of the annual Demographia International Housing Affordability Survey and author of Demographia World Urban Areas.
Mayor Tom Bradley appointed him to three terms on the Los Angeles County Transportation Commission (1977-1985) and Speaker of the House Newt Gingrich appointed him to the Amtrak Reform Council, to complete the unexpired term of New Jersey Governor Christine Todd Whitman (1999-2002). He is author of War on the Dream: How Anti-Sprawl Policy Threatens the Quality of Life and Toward More Prosperous Cities: A Framing Essay on Urban Areas, Transport, Planning and the Dimensions of Sustainability.


