
Japan has done remarkably well in controlling the Covid-19 virus. The nation’s death rate per million population at 0.9, is very low by international standards and the lowest among the G-7 nations. Yet there are significant variations among the prefectures — as elsewhere — by urban densities. Japan has 47 prefectures, which are the largest sub-national jurisdictions and are analogous to US states or Canadian provinces.
This article describes death rates by Japanese prefecture with comparisons to measures of urban population density. Like states in the United States or Australia or provinces in Canada, all prefectures have considerable rural land. There is considerable variation in the proportion of rural land, which makes the use of overall prefectural population densities unreliable for comparing urban densities. Urban densities, of course, are far more material with regard to a disease that spreads by personal proximity or “exposure density”.
Densely Inhabited Districts (DIDs)
We can make some tentative judgments about the relationship to urban densities by using “densely inhabited districts” (DIDS), which can be used to measure concentration of population at the prefecture level (Figure 1). According to Statistics Japan:
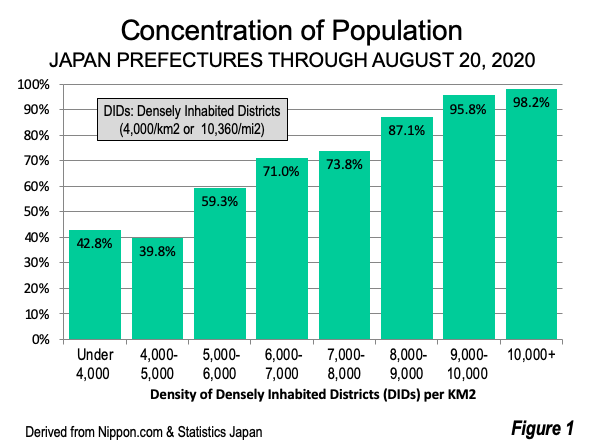
Densely Inhabited District which is often referred to as DID and is defined as an area a city, town or village that is composed of a groups of contiguous basic unit blocks each of which has a population density of about 4,000 inhabitants or more per square kilometer, and whose total population exceeds 5,000 as of October 1, 2000.
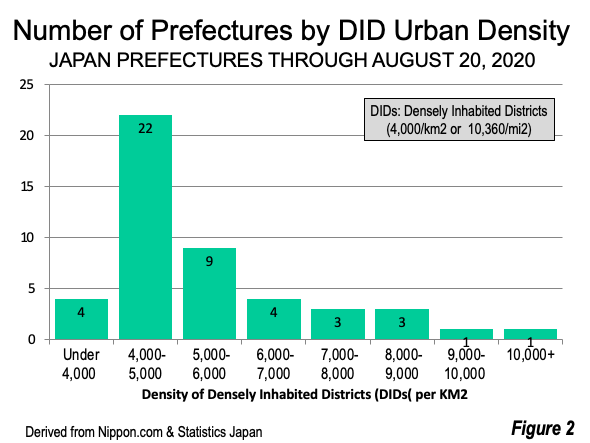
This article provides Covid-19 death rates by prefecture by the density of their DIDs. The Covid-19fatality data is from www.nippon.com. Population, land area and density population density data is from Statistics Japan for the 2010 census. The number of prefectures by DID density is in Figure 2.
DID Urban Population Density and COVID-19 Death Rates
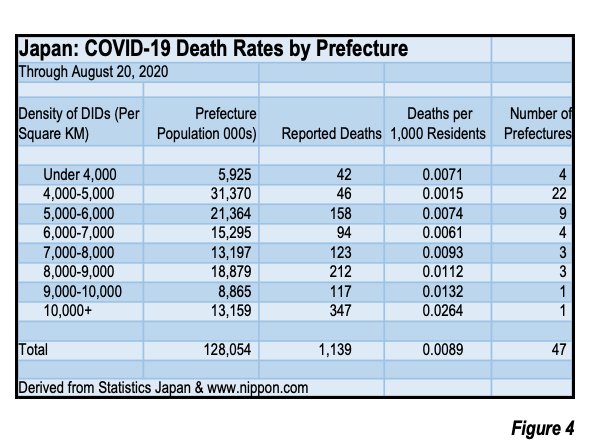
Fatality ratios are higher per capita where DID densities are higher, as is illustrated in Figure 3 and Figure 4. The proportion of fatalities is compared to population shares in Figure 5.
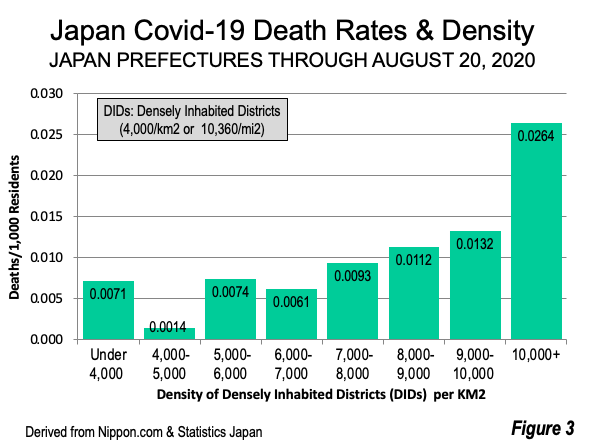
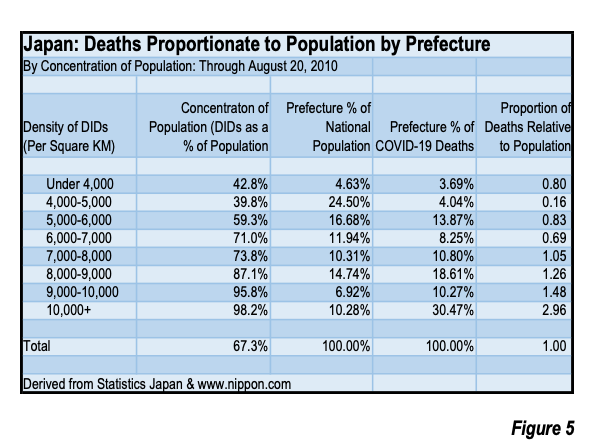
10,000 & Over per sq. km (25,900 per sq. mi. & over): In the highest density category, the death rate of 0.0264 is approximately three times the national rate of 0.0089. The only prefecture at this density is Tokyo (called the Tokyo metropolis, but with only about one-third of the Tokyo metropolitan area population). Tokyo’s fatality rate is 5.8 times that of the prefectures with DID densities under 8,000 per square kilometer. These prefectures have 57% of the national population and a fatality rate of 0.0046 per 1,000 population. Tokyo’s proportion of national Covid-19 fatalities is 4.8 times its proportion of the population (Figure 5). Tokyo’s DID density is 12,000 per square kilometer (31,100 per square mile).
9,000 — 10,000 per sq. km (23,310 — 25,900 per sq. mi.): The only prefecture with a DID population density of from 9,000 to 10,000 per square kilometer is Osaka, which is at the core the Osaka-Kobe-Kyoto urban area. Osaka-Kobe-Kyoto has been Japan’s second largest for decades and includes the city of Osaka. The fatality rate is 0.0132 per 1,000 inhabitants, half that of Tokyo. Osaka’s DID density is 9,400 per square kilometer (24,300 per square mile). Osaka’s fatality ratio is 1.49 times its share of the national population.
8,000 — 9,000 per sq. km (20,720 — 23,310 per sq. mi.): Three prefectures have DID densities of 8,000 to 9,000 per square kilometer. Their combined fatality rate is 0.0112 per 1,000, less than half that of Tokyo and just below that of Osaka. Two of the three are located adjacent to Tokyo. They are Kanagawa, where the city of Yokohama is located,bordering Tokyo on the south and Saitama, on the north. The third is Kyoto, the location of Kyoto, the former imperial capital. The three prefectures have an average DID density of 8,700 per square kilometer (22,400 per square mile). The fatality rate in Kanagawa, Saitama and Kyoto is 1.27 times their share of the population.
7,000 — 8,000 per sq. km (18,130 — 20,720 per sq. mi.): Three prefectures also have DID densities of 7,000 to 8,000 per square kilometer. One is Chiba, which borders Tokyo on the east and is the home of Narita International Airport. Hyogo, is adjacent to Osaka on the west, and includes the city of Kobe, site of the devastating 1996 earthquake. Okinawa is the third, located well to the south of Kyushu, the most southerly of Japan’s four large islands.The combined fatality rate was 0.0093, just above the national rate of 0.0089. These prefectures have approximately the same share of Covid-19 fatalities as their populations (1.05).
6,000 — 7,000 per sq. km (15,540 — 18,130 per sq. mi.): The four prefectures with DID densities between 6.000 and 7,000 per square kilometer have a fatality rate of 0.0061 per thousand, well below the national rate. One is Aichi, the core of the Nagoya urban area. Another is Shiga, which separates Aichi from Kyoto. Nara, located immediately east of Osaka is also just south of Kyoto and preceded it as national capital. The last is Fukuoka, which includes the two major urban areas of Fukuoka and Kitakyushu. These fatalities in the four prefectures aremore than 30% below their share of the national population.
Under 6,000 per sq. km (Under 15,540 per sq. mi.): The prefectures with DID densities under 6.000 per square kilometer have an overall fatality rate of 0.0042 per thousand, less than one-half the national rate. These fatalities in the four prefectures are more than 50% below their share of the national population.
Densely Inhabited Districts and Urbanization
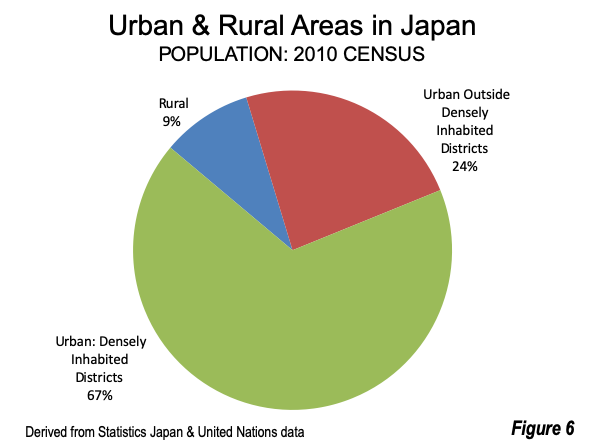
The 4,000 per square kilometer density threshold of the DIDs is far higher than the generally accepted international urban density threshold of 400 per square kilometer. According to the United Nations, 90.8% of Japan’s population was urban in 2010. The data above do not include the more than one quarter of urbanization in Japan that is not in densely inhabited districts (Figure 6).
Lockdown Avoided
Interestingly, Japan did not implement a formal legal lockdown. According to the BBC, the government launched “a nationwide campaign warning people to avoid the ‘Three Cs’:
- Enclosed spaces with poor ventilation
- Crowded places with many people
- Close contact setting such as face-to-face conversations.”
The campaign was successful. During May, Google Mobility report data indicates that visits to workplaces in Tokyo prefecture were down a daily average of more than 40%. Dr Kazuaki Jindai, of Kyoto university and member of the cluster-suppression taskforce told BBC: "I think that probably worked better than just telling people to stay at home".
Despite Japan’s success in managing Covid-19, Japan still exhibits a similar population dynamic as other nations with much higher death rates, such as the United Kingdom and the United States —where fatality rates are far higher where there are higher urban population densities. It is not the population densities alone, but more importantly that there is a much greater likelihood of overcrowded conditions.
As an open letter from 239 scientists in 32 countries to the World Health Organization (WHO) put it, the “problem is especially acute in indoor or enclosed environments, particularly those that are crowded and have inadequate ventilation relative to the number of occupants and extended exposure periods.”
Japan has indeed done an exemplary job on the pandemic, but still the same dynamics of greater infection in denser areas indicates a pattern that transcends nations, cultures and continents.
Photograph: Fukuoka, Japan central business district (by author)
Wendell Cox is principal of Demographia, an international public policy firm located in the St. Louis metropolitan area. He is a founding senior fellow at the Urban Reform Institute, Houston and a member of the Advisory Board of the Center for Demographics and Policy at Chapman University in Orange, California. He has served as a visiting professor at the Conservatoire National des Arts et Metiers in Paris. His principal interests are economics, poverty alleviation, demographics, urban policy and transport. He is co-author of the annual Demographia International Housing Affordability Survey and author of Demographia World Urban Areas.
Mayor Tom Bradley appointed him to three terms on the Los Angeles County Transportation Commission (1977-1985) and Speaker of the House Newt Gingrich appointed him to the Amtrak Reform Council, to complete the unexpired term of New Jersey Governor Christine Todd Whitman (1999-2002). He is author of War on the Dream: How Anti-Sprawl Policy Threatens the Quality of Life and Toward More Prosperous Cities: A Framing Essay on Urban Areas, Transport, Planning and the Dimensions of Sustainability.


