
For decades, New York has been the leading exporter of people to other states, though has been severely challenged since 2000 by California. During five years around the housing bust, more net domestic migrants left California than New York. Then, for a time, California’s annual losses were not quite as severe, but were restored to the largest loss in 2019, according to Census Bureau estimates.
There has been considerable publicity about the net domestic migration losses of from 2010 to 2019: New York (minus 1,380,000), California (minus 912,000), Illinois (minus 866,000) and New Jersey (minus 491,000), and about the many who relocated to the most popular destinations, Florida (1,230,000), Texas (1,146,000), North Carolina (476,000) and Arizona (453,000).
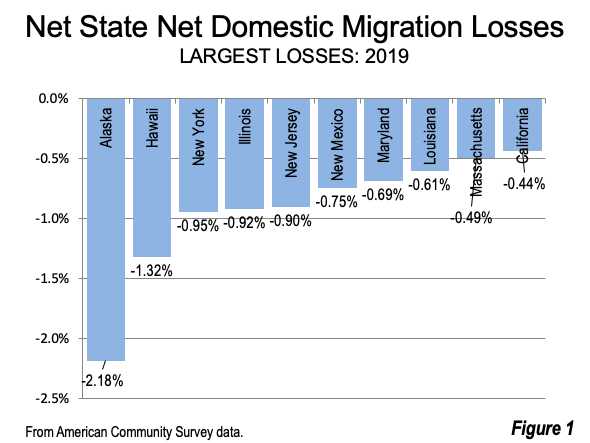
Yet, as the list of the 50 biggest moves below shows, some of the strongest moves are fairly local and not often highlighted. A review of the biggest moves --- the net population migrating between states (and the District of Columbia) reveals that the top 10 such pairs, represent more than one-third of all the 2019 net domestic migration in the nation (about 785,000), according to American Community Survey data. This concentration compares to the overall possible pairs of more than 2,500 (such as Alabama to Arizona and Arizona to Alabama, etc.). The four largest losing states (New York, California, Illinois and New Jersey) are large, ranking first, fourth, sixth and 11th in population. Even so, their net domestic outmigration rates all rank in the top ten (Figure 1).
Among the 10 pairs with the greatest net migration of net migrants (in migration minus out migration), just four states account for all of the largest losses: California (holding 4 positions), New York (3), New Jersey (2) and Illinois (1). The destination states are far more dispersed, with 8 states represented in the top ten. Two states appear twice, the year’s net domestic migration leader Florida, and rather surprisingly Pennsylvania, which has been one of the slowest growing states for decades
Leaving California: The largest interstate move in 2019 was from California to Texas, with a net migration of 45,200 residents. California also sent a net 31,500 residents to Arizona, the third largest loss, 20,900 to Nevada, the sixth largest loss and 20,700 to Oregon, the eighth largest loss. Interestingly, the three of the four largest number of leavers went to the states that border California, while the largest number was attracted by Texas, with its major metropolitan areas more than 1,000 miles away.
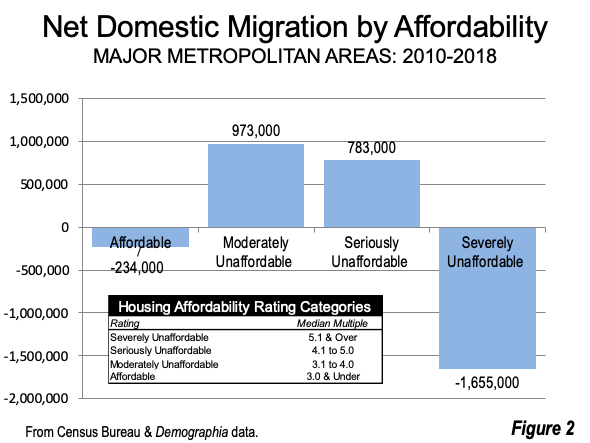
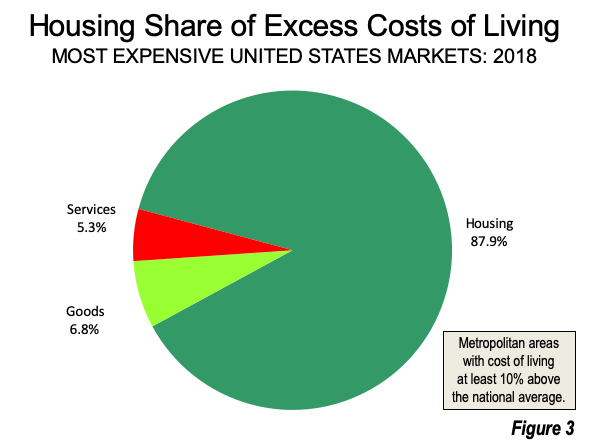
The most likely driver of this migration is California’s high cost of living. Each of the recipient states have a lower cost of living than California, with its excessively high housing costs and high taxes. Not surprisingly, better housing affordability (lower house prices relative to incomes) is strongly related to net domestic migration (Figure 2). Housing costs represent more than 85% of the cost of living difference between higher cost metropolitan areas (like in California) and the national average (Figure 3) and housing affordability is strongly related to net domestic migration. Moreover, Arizona also has an advantage with its strong attraction to retirees.
Leaving New York (and New Jersey): Movers from New York to Florida accounted for the second largest volume (38,500). But many New Yorkers are moving to nearby states. The fourth largest number of net migrants left New York for New Jersey (26,700) and the fifth largest number left New York for Pennsylvania (24,000). Another 12,600 New Yorkers relocated to adjoining Connecticut, which ranked 21st among the larger migration pairs. Nearby New Jersey, which gained so many New Yorkers, itself gave up 20,900 residents to Pennsylvania, while Maryland sent 7,300 residents to Pennsylvania (ranked 37th), one county ofwhich is in the Washington-Baltimore combined statistical area (commuting zone or CSA). The keystone state was the somewhat surprising domestic migration winner in the Northeast.
Leaving Illinois: There were strong movements out of Illinois to nearby states, including 19,200 net movers to adjacent Indiana, the 9th largest move. Another 10,400 exited northward to adjacent Wisconsin. This, like the New York area, could be at least partially a pre-pandemic flight away from density, with Chicago CSA core county Cook and its four adjacent counties accounting for nearly 70% of the huge Illinois state outmigration since 2010.
Moving to States in the Northeast: Much of New Jersey and counties both in northeastern Pennsylvania and western Connecticut are within the New York CSA. It seems likely that some of this migration reflects households seeking less dense, and more affordable, surroundings. This is even before the pandemic, with the strong movement reported from denser portions of urban areas to suburbs and exurbs. The city of New York, far and away the nation’s densest urbanization, experienced a net domestic outmigration of 900,000 between 2010 and 2019, accounting for 65% of the state loss (according to Census Bureau estimates).
Big Moves Between Attractor States: Even the states that attract the most domestic migrants can lose migrants to other states. For example, domestic migration leader Florida lost 15,100 residents to Texas (the 12th largest move). Second largest attractor Texas lost 14,100 net residents to Colorado (the 16th largest move). Tennessee, a strong gainer, attracted 7,000 residents from Florida and 5,200 from Texas.North Carolina, which has been the third strongest gainer in this decade lost 6,200 migrants to neighboring South Carolina in 2019 (the 45th largest move).
The Moving Across the Nation and Across the State Line
Net domestic migration continues to be principally to the South, the intermountain West and the Pacific Northwest, with most destinations having a lower cost of living than California or New York. Yet, as indicated above, that is not all the story. There are still strong moves within regions and sub regions, throughout the Northeast and Midwest, as the strong moves to Pennsylvania, Connecticut, Wisconsin, New Jersey and Indiana attest. The big flight may be from New York and California to places like Texas and Florida, but the story is more nuanced and complex than is often supposed.
Wendell Cox is principal of Demographia, an international public policy firm located in the St. Louis metropolitan area. He is a founding senior fellow at the Urban Reform Institute, Houston and a member of the Advisory Board of the Center for Demographics and Policy at Chapman University in Orange, California. He has served as a visiting professor at the Conservatoire National des Arts et Metiers in Paris. His principal interests are economics, poverty alleviation, demographics, urban policy and transport. He is co-author of the annual Demographia International Housing Affordability Survey and author of Demographia World Urban Areas.
Mayor Tom Bradley appointed him to three terms on the Los Angeles County Transportation Commission (1977-1985) and Speaker of the House Newt Gingrich appointed him to the Amtrak Reform Council, to complete the unexpired term of New Jersey Governor Christine Todd Whitman (1999-2002). He is author of War on the Dream: How Anti-Sprawl Policy Threatens the Quality of Life and Toward More Prosperous Cities: A Framing Essay on Urban Areas, Transport, Planning and the Dimensions of Sustainability.
Photograph: Moving from New York: Pennsylvania suburbs (Pike County), by author.
Net Domestic Migration
Top 50 State to State Moves: 2019
| Rank | FROM-TO | Net Movers | Rank | FROM-TO | Net Movers | |
| 1 | California-Texas | 45,172 | 26 | Illinois-Wisconsin | 10,381 | |
| 2 | New York-Florida | 38,512 | 27 | Illinois-Florida | 9,891 | |
| 3 | California-Arizona | 31,487 | 28 | Illinois-California | 9,393 | |
| 4 | New York-New Jersey | 26,722 | 29 | Washington-Arizona | 9,373 | |
| 5 | New York-Pennsylvania | 23,977 | 30 | California-Utah | 9,317 | |
| 6 | California-Nevada | 20,889 | 31 | New York-Georgia | 8,703 | |
| 7 | New Jersey-Pennsylvania | 20,850 | 32 | Maryland-North Carolina | 7,955 | |
| 8 | California-Oregon | 20,662 | 33 | New Mexico-Texas | 7,663 | |
| 9 | Illinois-Indiana | 19,172 | 34 | Virginia-California | 7,512 | |
| 10 | New Jersey-Florida | 16,190 | 35 | Maryland-Pennsylvania | 7,283 | |
| 11 | Pennsylvania-Florida | 15,336 | 36 | New York-South Carolina | 7,247 | |
| 12 | Florida-Texas | 15,064 | 37 | Maryland-Florida | 7,065 | |
| 13 | California-Washington | 14,909 | 38 | Massachusetts-New Hampshire | 6,992 | |
| 14 | Illinois-Texas | 14,641 | 39 | Florida-Tennessee | 6,966 | |
| 15 | California-Colorado | 14,265 | 40 | Illinois-Colorado | 6,698 | |
| 16 | Texas-Colorado | 14,106 | 41 | Massachusetts-Florida | 6,696 | |
| 17 | Ohio-Florida | 13,745 | 42 | New Jersey-Georgia | 6,540 | |
| 18 | New York-North Carolina | 13,724 | 43 | Missouri-Kansas | 6,380 | |
| 19 | California-Idaho | 13,350 | 44 | Indiana-Florida | 6,249 | |
| 20 | New York-California | 13,235 | 45 | North Carolina-South Carolina | 6,200 | |
| 21 | New York-Connecticut | 12,566 | 46 | Pennsylvania-North Carolina | 6,120 | |
| 22 | Oregon-Washington | 12,373 | 47 | Illinois-Tennessee | 6,089 | |
| 23 | Michigan-Florida | 11,727 | 48 | California-Tennessee | 6,011 | |
| 24 | New Jersey-North Carolina | 11,003 | 49 | California-Florida | 5,936 | |
| 25 | Illinois-Georgia | 10,828 | 50 | New Jersey-Delaware | 5,889 | |
| Data Derived from American Community Survey | ||||||


