
This article describes the reduction in work visits, by counties within the six combined statistical areas (CSAs), also called commuting zones, that include the nation’s six largest downtown areas (central business districts, or CBDs) by employment. CSAs are combinations of adjacent metropolitan and micropolitan areas that have strong work trip commuting connections, but not as strong as within metropolitan areas (MSAs). These CSAs are also home to the nation’s six “transit legacy cities” (the municipalities of New York, Chicago, Philadelphia, San Francisco, Boston and Washington). These cities (which are to be contrasted with metropolitan areas) accounted for 58% of transit commuting destinations in 2018.
The Google Mobility Reports
The data in this article is based on “Google COVID-19 Community Mobility Reports,” which estimate visits to work by people compared to a pre-COVID base of January 3 to February 6, 2020 for various activities, including trips to the workplace. Google provides estimates at the county level.
The period covered is January 1 to 22, 2021, which could be particularly significant, since in recent days easing of “lockdowns,” has been discussed. a major factor in the trip declines. Substantial weakening of the lockdown restrictions would seem likely to bring an increase in the work trip visits to the most impacted areas, particularly the core counties that contain the largest CBDs.
Google provides this description of the Community Mobility Reports:
The reports use aggregated, anonymized data to chart movement trends over time by geography, across different high-level categories of places such as retail and recreation, groceries and pharmacies, parks, transit stations, workplaces, and residential. We’ll show trends over several weeks, with the most recent information representing 48-to-72 hours prior. While we display a percentage point increase or decrease in visits, we do not share the absolute number of visits. To protect people’s privacy, no personally identifiable information, like an individual’s location, contacts or movement, is made available at any point.
In this analysis, CSA counties are divided into three categories. The first category includes the county with the largest CBD.The second category is the other counties within the metropolitan area that contains the largest CBD (the “principal MSA,” see note). The third category is counties in the metropolitan and micropolitan areas that comprise the expanded territory of the CSA (outside the principal MSA). In two of the six CSAs there are additional categories. In New York, there is a separate category for the outer counties (boroughs) of the city of New York, and the suburban counties within the principal MSA are divided into inner ring and outer ring counties. In Washington, there is a separate category for the city of Baltimore, which is itself a large urban core, but which has been subsumed into the larger CSA in which Washington is the principal MSA. This makes Baltimore (a city-county) an outside MSA county, which is shown separately.
Among the cores of the six CSAs, four are coterminous with counties, including New York (Manhattan, which as New York County is one of New York City’s five boroughs or counties) as well as the city (and county) of Philadelphia, San Francisco, and Washington, which as the District of Columbia is a county equivalent jurisdiction).
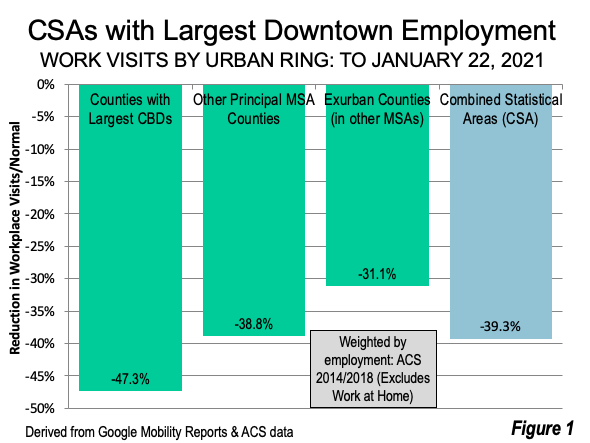
Overall, the counties with the largest CBDs have experienced a reduction of 47.3% in work place visits. The remainder of the counties in the principal MSAs are down 37.8% (this includes the outer boroughs of New York City. The exurban counties (in adjacent metropolitan and micropolitan areas) are down 30.9%. Thus, the core counties have had about a one-half greater loss in work trip visits than the exurban counties (Figure 1).
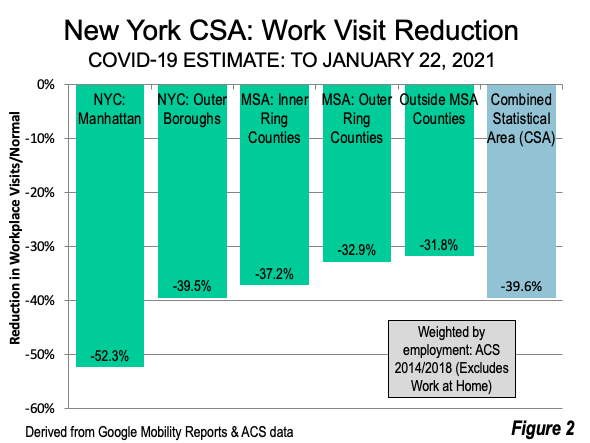
New York CSA: The New York CSA includes 30 counties, covering 12,400 square miles (33,100 square kilometers), an area nearly equal in size to the combined states of Massachusetts and Connecticut. The New York CSA extends beyond the metropolitan area to include counties such as Fairfield (Bridgeport-Stamford) and New Haven in Connecticut, Mercer (Trenton) in New Jersey, Dutchess and Orange in New York and Monroe in Pennsylvania. New York is the largest CSA and has a sufficient number of counties to produce a more fine-grained analysis. Further, the New York CSA has the most diverse in urban form in the nation, with by far the nation’s densest central business district and the highest density neighborhoods as well as overall suburban densities that, perhaps surprisingly, are barely one half that of Los Angeles suburbs.
Work trip visits are down substantially (52.3%) in the urban core of New York County (Manhattan), which includes by far the nation’s largest and densest central business district, and the second largest in the world. The four other core municipality counties (comprising The Bronx, Brooklyn, Queens and Staten Island) are down 39.5%, while work trip travel in inner ring suburban counties has dropped 37.2% and the outer ring suburban loss of 32.9%. The exurban counties have seen a work trip visit drop of 31.8% (Figure 2). The CSA loss was 39.6%.
San Francisco Bay CSA: The San Francisco Bay CSA includes 14 counties and covers 10,600 square miles (27,500 square kilometers), approximately the same land area as the combined states of Vermont and Rhode Island. The San Francisco Bay CSA extends beyond the 5-county MSA to include counties such as Santa Clara (the heart of Silicon Valley, Sonoma and Solano that have traditionally been considered to be in the Bay area. However, longer and more intense commute patterns have resulted in a redefinition of the CSA to include three counties in the San Joaquin Valley (San Joaquin, Stanislaus and Merced), with Merced’s southern border more than 150 miles from downtown San Francisco.
The city of San Francisco had the largest core county drop in workplace visitations, at 55.0%. Santa Clara County (San Jose), the center of Silicon Valley, but outside the San Francisco metropolitan area, suffered a drop of 48%, while suburban San Mateo County lost 46%. Overall, the loss in the suburban counties of the MSA was 42.1%, while the loss in the CSA counties outside the MSA such as San Joaquin and Merced was 37.4%. The overall CSA loss was 41.9% (Figure 3).

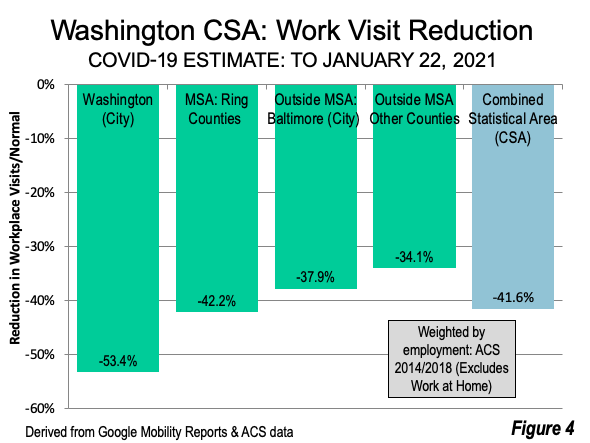
Washington CSA: The Washington-Baltimore CSA covers 13,600 square miles (35,100 square kilometers), about the same land area as Massachusetts, Connecticut and Rhode Island combined. It extends to counties in Pennsylvania and West Virginia. This CSA is unusual in its having absorbed one of the nation’s historically large metropolitan areas and its dense core city (Baltimore).
The city of Washington experienced a loss of 53.4% in work place visits. The Washington metropolitan area suburbs had a loss of 42.2%. The decline was lower in exurban counties (including the city of Baltimore), while the entire CSA showed a loss of 41.6% (Figure 4).
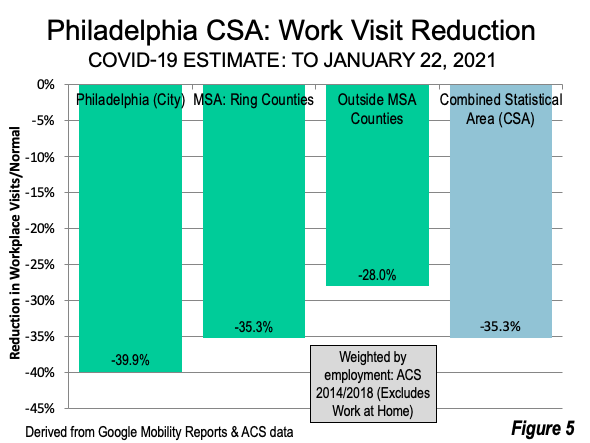
Philadelphia CSA: The Philadelphia CSA covers 7,300 square miles (19,000 square kilometers) and 16 counties. This is an area approximately equal to the size of Massachusetts. The CSA includes additional counties in Pennsylvania, such as Atlantic (Atlantic City) and Berks (Reading). The city of Philadelphia lost 39.9% of its workplace visits. The suburban counties declined 35.3%, while the counties outside the MSA lost 28.0%. The overall CSA loss was 35.3% (Figure 5).
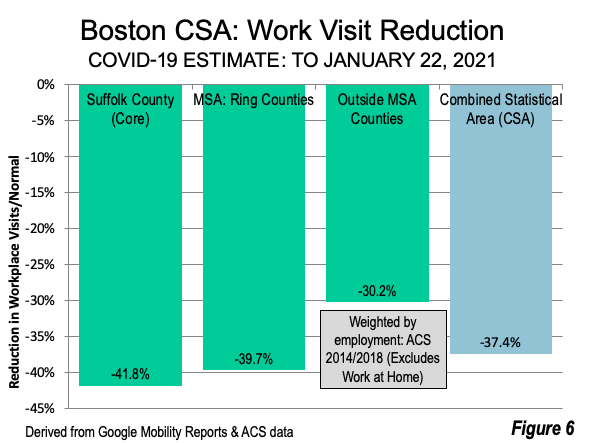
Boston CSA: Unlike the CSA’s above, the 19-county Boston CSA covers 9,700 square miles, (25,100 square kilometers) about the size of Maryland. The city of Boston has approximately 85% of the core county (Suffolk) population. Suffolk County experienced a workplace visit loss of 41.8%. Suburban MSA counties lost 39.7%, while counties outside the CSA lost 29.3%. Overall, the Boston CSA loss was 37.4% (Figure 6).
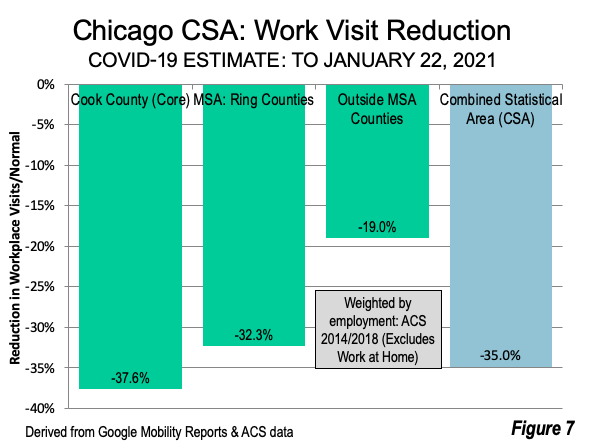
Chicago CSA: The 19-county Chicago CSA covers 8,900 square miles, (23.000 square kilometers), about the size of New Hampshire. The core county is Cook, with the population nearly equally distributed between the core city of Chicago and suburban jurisdictions. Cook County’s workplace visits were down 37.6%. The suburban counties had a loss of 32.3%, while the counties outside the MSA lost 19.0%. The overall loss was 35.0% (Figure 7).
Overcrowded Areas Subject to Greater Economic Disruption
All sectors of the nation’s CSA have proven vulnerable to the pandemic. However certain areas, particularly those with the transit legacy cities, with the largest CBDs and greatest transit dependency, have suffered markedly worse. Like the counties with the highest urban densities, these core areas have a propensity for greater overcrowding in insufficiently ventilated enclosed spaces.
The decline in activity has been stunning. In New York City, subway weekday ridership remained about 70% below comparable days last week compared to 2019 (this excludes Monday, which was the Martin Luther King, Jr. holiday). Long Island rail ridership was down more than 75%, while Metro North rail ridership (from the Hudson Valley and Connecticut) was down more than 80%. San Francisco’s BART regional rail ridership was down nearly 90%.
The current extent of the muted activity in the largest CBDs can be seen in live cameras, especially at peak hours. For example, during the morning peak last week, 5th Avenue between 49th and 50th Streets exhibited little traffic (just south of St. Patrick’s Cathedral, with Sak’s Fifth Avenue to the right). For example live cameras can be accessed for New York at noted location, or for the Chicago Loop on State Street, just north of Macy’s (formerly Marshall Field’s).
With lockdowns becoming less stringent, it will be interesting to see the rate and extent of recovery that these inner areas achieve.
Note: For the purposes of this article, the principal MSA of a CSA contains the largest CBD.
Wendell Cox is principal of Demographia, an international public policy firm located in the St. Louis metropolitan area. He is a founding senior fellow at the Urban Reform Institute, Houston and a member of the Advisory Board of the Center for Demographics and Policy at Chapman University in Orange, California. He has served as a visiting professor at the Conservatoire National des Arts et Metiers in Paris. His principal interests are economics, poverty alleviation, demographics, urban policy and transport. He is co-author of the annual Demographia International Housing Affordability Survey and author of Demographia World Urban Areas.
Mayor Tom Bradley appointed him to three terms on the Los Angeles County Transportation Commission (1977-1985) and Speaker of the House Newt Gingrich appointed him to the Amtrak Reform Council, to complete the unexpired term of New Jersey Governor Christine Todd Whitman (1999-2002). He is author of War on the Dream: How Anti-Sprawl Policy Threatens the Quality of Life and Toward More Prosperous Cities: A Framing Essay on Urban Areas, Transport, Planning and the Dimensions of Sustainability.
Photo credit: 30 Rockefeller Center Building, from 5th Avenue between 49th & 50th, New York (early December 2019), by author.


