
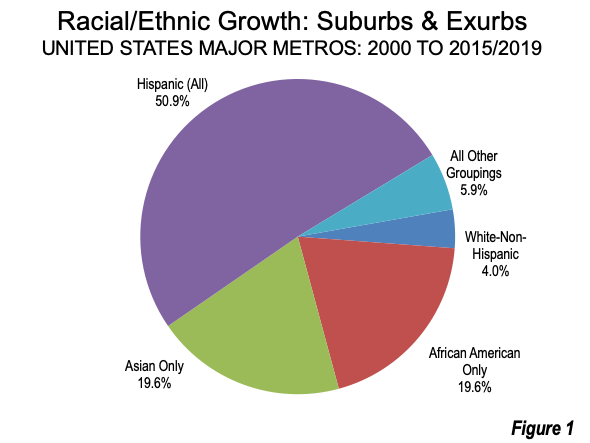
A few months ago, we reported on the strong attraction of the suburbs and exurbs in the growth of the largest metropolitan areas (a City Sector Model [Note 1] analysis, Minorities Dominate Suburban Growth). That article showed that from 2000 to 2015/2019 (middle year 2017), White Non-Hispanics accounted for only four percent of suburban and exurban population growth in the 53 major metropolitan areas (over 1,000,000 population). Hispanics accounted for 50.9% of the growth, followed by African Americans and Asians (“only” or one-race), each at 19.6% and 5.9% in smaller minority groups, or more than one race (Figure 1).
Largest Minorities Gain 1.55 Million, White Non-Hispanics Drop 260,000
This was even more the case in California. The three largest minorities (African Americans, Asians, and Hispanics) dominated suburban and exurban population growth in the six largest California metros to an even greater degree from 2010 to 2015/2019, according to American Community Survey data (Note 2).
Overall, the three-minority population gain in the suburbs and exurbs of Los Angeles, San Francisco, Riverside-San Bernardino, San Diego, Sacramento, and San Jose combined rose by 1.55 million over the period. This compares to the total increase of 1.29 million for the four largest racial and ethnic groupings (the three minorities plus White Non-Hispanics). By comparison, and surprisingly, Minorities accounted for about half the population gain in the Urban Core as in the suburbs and exurbs.
120% of Suburban & Exurban Growth in the Suburbs and Exurbs
For minorities, suburbs were where the action has been. The minority population growth was 119.9% of the total, when White Non-Hispanics are included (Figure 2), meaning that minorities grew while White Non-Hispanics declined in total.

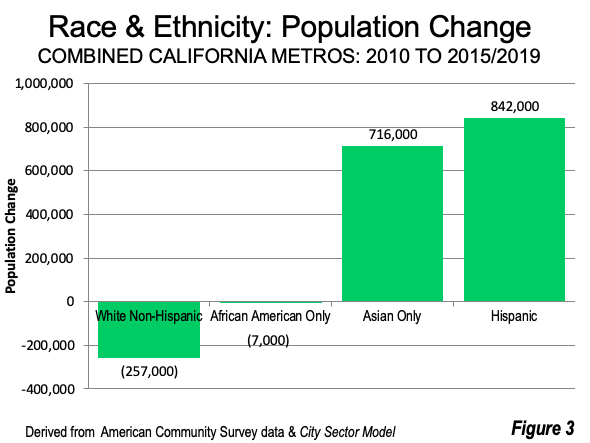
Combining the data for the six metropolitan areas shows that during the 2010s, Hispanic population growth was 65.1% (842,000) of the growth among the four largest racial and ethnic groupings, whileAsians accounted for 55.3% of the growth (716,000). African Americans, whose census reported population is dropping in California (Note 3), were also shown to be declining (minus 7,000) in the suburbs and exurbs, for a 0.6% loss (Figure 3). There was a much greater loss (minus 257,000) in the White Non-Hispanic suburban and exurban population.
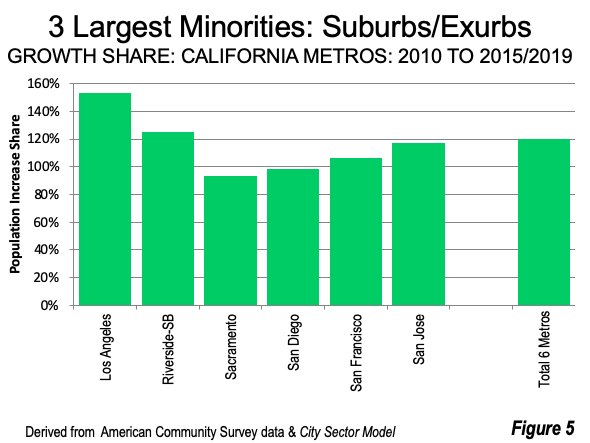
Suburb/Exurb Growth 150% Minority in LA, 90-125% in the Other Five Metros
The three largest minority populations grew in the suburbs and exurbs more than the overall growth in four of the six metropolitan areas when White Non-Hispanics are included (Figures 4 and 5).
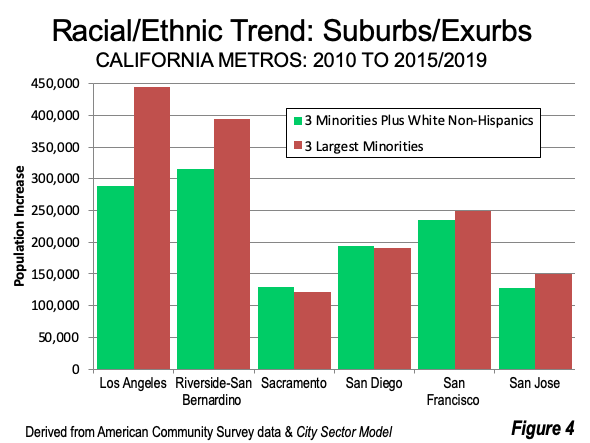
- In Los Angeles, the three minorities grew 444,000, 53% more than the overall total when White Non-Hispanics are included (289,000).
- In Riverside-San Bernardino, the three minorities grew 395,000, 25% more than the overall total when White Non-Hispanics are included (316,000).
- In San Jose, the three minorities grew 151,000, 17% more than the overall total when White Non-Hispanics are included (129,000).
- In San Francisco, the three minorities grew 260,000, 6% more than the overall total when White Non-Hispanics are included (236,000).
In the other two metropolitan areas, the three minorities exceeded 90% of the total growth.
- In San Diego, the three minorities grew 191,000, equal to 98% of the overall total when White Non-Hispanics are included (194,000).
- In Sacramento, the three minorities grew 121,000, equal to 93% more than the overall total when White Non-Hispanics are included (129,000).
The Pervasive Minority Dispersion to the Suburbs and Exurbs
A clear pattern of dispersion among the largest minorities is clear. In each of the City Sector Model suburban and exurban categories (Figure 11, below), the three largest minorities dominate population growth.
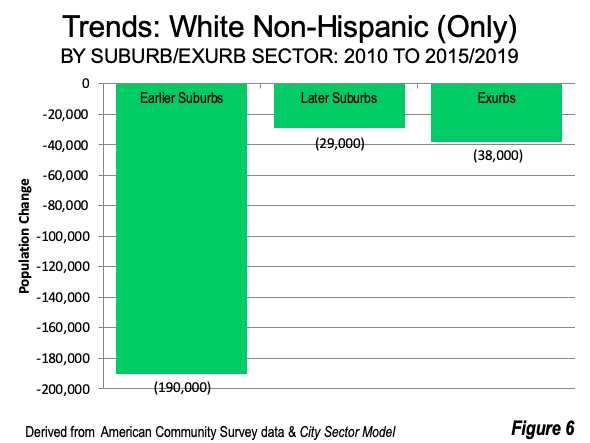
This is evident by the losses sustained across-the-board among White Non-Hispanics, where the population dropped in all three suburban and exurban categories. The largest loss was in the Earlier Suburbs. White Non-Hispanics were the only racial/ethnic grouping that sustained a loss in either the Exurbs or the Later Suburbs (Figure 6).
The trends were more favorable among the three large minorities.
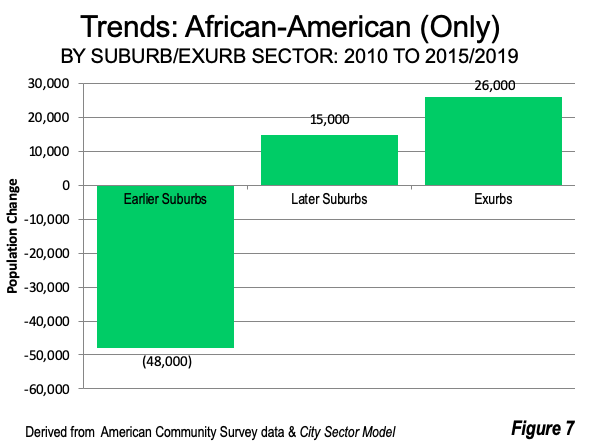
- While there was a small overall loss among African Americans, their gains in the two outer geographies (Later Suburbs and Exurbs) were in contrast to the White Non-Hispanic losses (Figure 7). At the same time, the African Americans population were dropping in the Earlier Suburbs, indicating both movements to the Later Suburbs and Exurbs as well as other metropolitan areas, outside the state, areas where economic prospects, including the prospects of buying a home, are better.
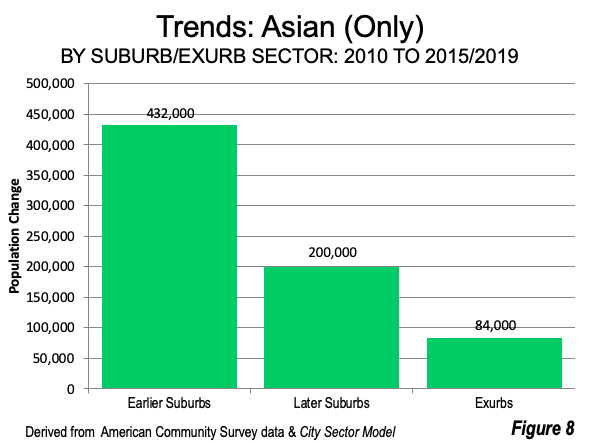
- Among Asians, the largest growth was in the Earlier Suburbs, with rapid growth in the Later Suburbs and less growth in the Exurbs (Figure 8).
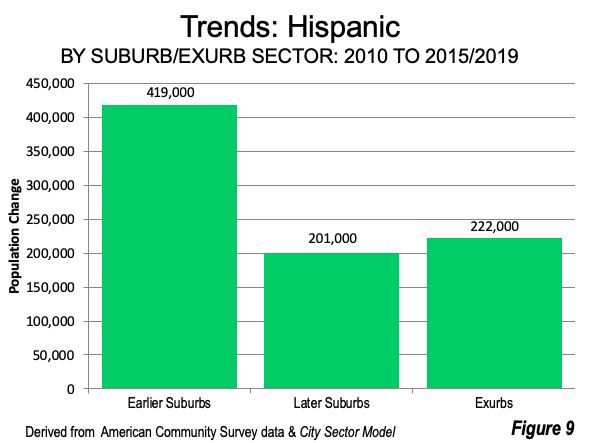
- Among Hispanics, the growth in the Earlier Suburbs nearly matched that of Asians, as well as in the Later Suburbs. However, Hispanic growth dominated the Exurbs (Figure 9), capturing 75% of the total growth (222,000 of 294,000).
Preferences and Policies
These trends are all the more remarkable given state, regional and local policies discouraging population dispersion and the use of cars. Indeed, in 2019 (the last pre-pandemic year), a record number of Californians drove alone to work on a daily basis — 13.77 million. This is up from 11.65 million in 2010. Transit use was also up, by about the same percentage, from 820,000 to 970,000. However, that increase confirms no progress toward reducing car use.
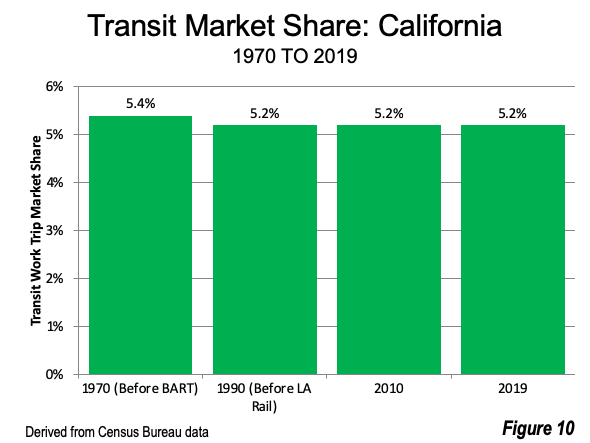
Moreover, there is considerable reason to believe that the commuting option so favored by public policy in California, transit, has little hope of capturing higher market shares. The statewide transit commuting market share remains has been stuck at 5,2% since 1980 and has declined since 1970 (Figure 10). Since that time, the state has added BART (Bay Area Rapid Transit District) in the San Francisco Bay Area, the metro rail system in Los Angeles, with six rail lines serving downtown, with another cross-town line, light rail in San Diego, Sacramento and San Jose and commuter rail lines, all of which were intended to improve transit’s market share.
BART was by far the most significant transit expansion over the last half century. After a near abandonment during the pandemic, when ridership dropped by 90 percent, budget officials indicated that it could take to the “end of the 2020s” to restore ridership to 80% of pre-pandemic levels. They cited data from the “Bay Area Council showing that most employers in the region expect their employees to be in the office only three days per week once the pandemic subsides.” It will be difficult to increase transit’s market share people commute less often.
All of this combined with the long-standing preference for home ownership accelerated by the pandemic, lower density detached housing and yards (gardens) could lead even greater dispersion, whether in California, or other states, where over the past two decades, millions of people, net, have moved from California. There is some truth to the economic dictum that “preferences trump policy.” California needs to get its policies in line with the preferences of its people, especially the middle-income and low-income households that are so disadvantaged by current policies.
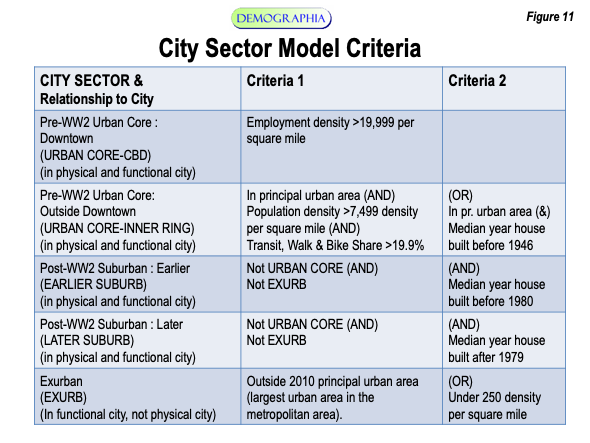
Note 1: The City Sector Model classifies small areas (ZIP codes, more formally, ZIP Code Tabulation Areas, or ZCTAs) in US metropolitan areas based upon their function as urban cores, suburbs, or exurbs. The criteria used are employment and population densities and the extent of transit use versus car use (Figure 10). The purpose of the urban core sectors is to replicate, to the best extent possible, the urban form as it existed before World War II, when urban densities were much higher and a far larger percentage of urban travel was on mass transit. The suburban sectors replicate the automobile-oriented suburbanization that began in the 1920s and escalated strongly following World War II. The suburban areas are within the continuous built-up urban areas, while the exurban areas are in the metropolitan areas, but outside the built-up urban areas. Currently, it is estimated that more than 86% of the population in the major metropolitan areas live in the suburbs or exurbs. By 1960, 49.5% of metropolitan population was outside the central cities, and by 1970, this number had risen to 54.5%, so that metropolitan populations were majority suburban and exurban (see: 1970 Census Publication, General Demographic Trends for Metropolitan Areas: 1960 to 1970, Detailed Table #2). back to article
Note 2: The total populations referred to in this article are for the four largest racial and ethnic groupings (White Non-Hispanic, African American, Asian, and Hispanic). In the 2010 census, 95% of the national population was in these four racial and ethnic groupings. back to article
Note 3: The data necessary for a City Sector Model analysis of trends from the 2010 to 2020 census has not been released. However, the overall data shows that the African American (only) population of the state dropped from 2.164 million in 2010 to 2.119 million in 2020, a decline of 3.1%. However, caution is suggested in the use of racial and ethnic grouping data between the two censuses, as there was an increase in respondents classifying themselves as multi-racial, rather than as one race, for example, African-America Only, Asian Only or White Non-Hispanic only. This issue could become the subject of academic research in the years to come. back to article
Wendell Cox is principal of Demographia, an international public policy firm located in the St. Louis metropolitan area. He is a founding senior fellow at the Urban Reform Institute, Houston, a Senior Fellow with the Frontier Centre for Public Policy in Winnipeg and a member of the Advisory Board of the Center for Demographics and Policy at Chapman University in Orange, California. He has served as a visiting professor at the Conservatoire National des Arts et Metiers in Paris. His principal interests are economics, poverty alleviation, demographics, urban policy and transport. He is co-author of the annual Demographia International Housing Affordability Survey and author of Demographia World Urban Areas.
Mayor Tom Bradley appointed him to three terms on the Los Angeles County Transportation Commission (1977-1985) and Speaker of the House Newt Gingrich appointed him to the Amtrak Reform Council, to complete the unexpired term of New Jersey Governor Christine Todd Whitman (1999-2002). He is author of War on the Dream: How Anti-Sprawl Policy Threatens the Quality of Life and Toward More Prosperous Cities: A Framing Essay on Urban Areas, Transport, Planning and the Dimensions of Sustainability.
Photo credit: Orange County, by author.


