
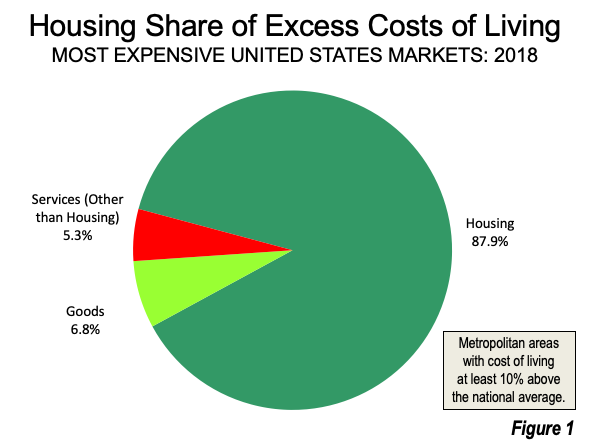
Some metropolitan areas continue to have higher costs of living relative to the national average. The most important component is the extent to which higher housing costs contribute to these differences. Our Urban Reform Institute Standard of Living Index showed that more than 85% of the difference between costs in the more expensive metropolitan areas and the nation was attributable to housing (Figure 1).
Costs of Living
The recently released 2020 Bureau of Economic Analysis (US Department of Commerce) Regional Price Parities estimates the difference in the cost of living among metropolitan areas. Regional Price Parities are the domestic equivalent of Purchasing Power Parities, the international formulas that equate, for comparison purposes, the value of American dollars, Canadian dollars, Australian dollars, Greek drachmas Chinese RMBs, etc. This makes it possible to compare the costs of living and standards of living between nations. But, as has become increasingly obvious, there are substantial differences in the cost of living within the United States itself, such as between metro San Francisco, Cincinnati, Charlotte and Allentown.
US Cost of Living Differences Between Metropolitan Areas
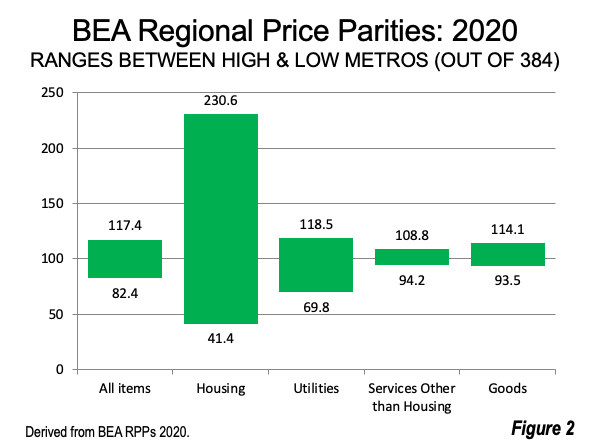
The overall variation in metro area Regional Price Parities (the cost of living) is 42.5%, between a low of 82.4 (Florence, AL) to a high of 117.4 (San Francisco, CA). with the national level at 100 (the index value). RPPs are produced in four categories, housing, goods, utilities and services other than housing. (Figure 2) Among the categories, the differences between metropolitan areas in the housing cost of living are far greater than in the others:
- The largest category difference is in housing, at 457.0% from a low of 41.4 (Johnstown, PA) to a high of 230.6 (San Jose). The difference in housing is nearly more than ten times that of the overall difference of 42.5% (above).
- The difference in utilities is 69.8%, between a high of 118.5 and a low of 68.9. By comparison, the housing cost of living varies by nearly seven times that of utilities.
- The difference in services other than housing is 15.5%, between a high of 108.8 and 94.2. The housing cost of living difference is 29 times that of services other than housing.
- The difference in goods is 22.0%, between a high of 114.1 and a low of 93.1, The housing cost of living difference is nearly 21 times that of goods.
The last two categories — services other than housing and goods, reflect costs of living that are near normal national rates.
Some analysts have suggested that commuting costs are a dominant factor in metropolitan area costs differences. However, as the data shows, there is little difference between metropolitan areas in the two categories that include the dominant mode of automobiles as well as transit: goods and services other than housing. While the costs of commuting are one of the larger elements of the household budget, their impact is insufficient to skew the costs of services other than housing and goods to beyond the modest levels (22% or less), of which they are components.
Net Domestic Migration
Net domestic migration gains are concentrated in metros with near the average housing cost of living, while the largest losses were in metros where the housing cost of living index was either much higher or much lower than the overall cost of living index (Figure 3).
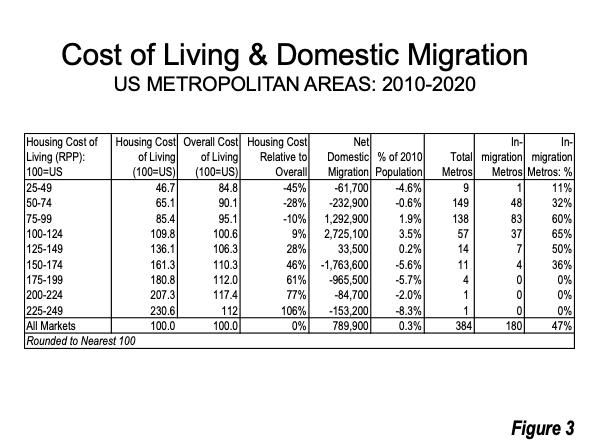
- Nearly 1,300,000 net domestic migrants moved into the metros with housing costs of living between 75 and 100. In this category, the housing cost of living index was 10% below the overall cost of living index.
- More than 2,700,000 net domestic migrants moved into the metros with housing costs of living between 100 and 125. In this category, the housing cost of living index was 9% above the overall cost of living index.
- A much smaller 33,000 net domestic migration gain was registered in metros with housing costs of living of 125 to 150. In this category, the housing cost of living index was 28% above the overall cost of living index.
- Metros with housing costs of living of 150 and above lost nearly 3,000,000 net domestic migrants. These metros had housing costs of living indexes from nearly 50% higher than the overall cost of living to 100% higher. The two metros with the highest housing costs of living, San Francisco and San Jose, are in what the San Francisco Chronicle has characterized as the “notoriously expensive Bay Area housing market.” For example, in San Jose, which has the highest housing cost of living in the nation (230.6) averages a cost of living of 100.0 in the three non-housing categories, while San Francisco (housing cost of living at 207.3) has an average cost of living of 104.9 in the three non-housing categories. The big differences are in housing.
- Metros with the lowest housing costs of living (under 75), however, lost nearly 300,000 residents. In these two categories, the housing cost of living index was from more than 28% and 45% below the overall cost of living index. These categories include a number of metropolitan areas that have faced significant economic challenges in recent decades, such as Johnstown, PA, Wheeling, WV-OH, Pueblo, CO and Joplin, MO. Some of these low-cost metros are located close enough to larger markets with greater opportunities that they could rebound with the adoption of hybrid commuting patterns (working part-time from home). For example, Dayton, OH is within hybrid commuting distance of Columbus, Indianapolis, and Cincinnati, while Fayetteville, NC is a hybrid commute from Raleigh.
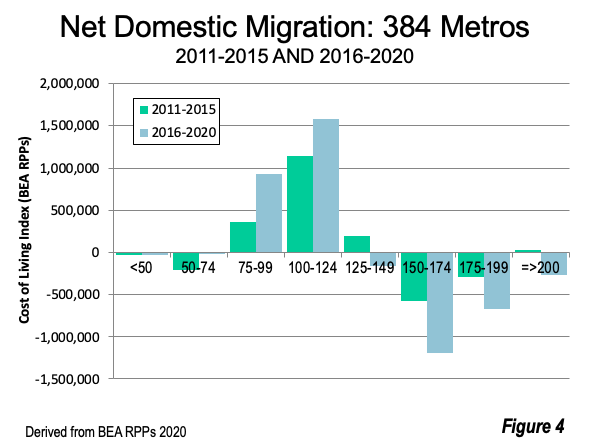
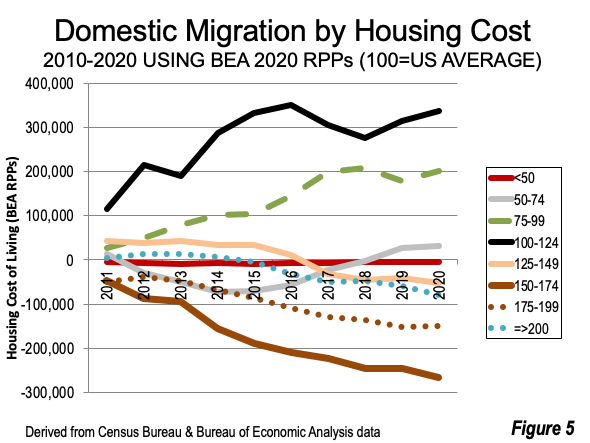
At the same time, the last half of the decade (2016-2020) exhibited a strengthening of in-migration trends to the metros with housing costs of living of 124 and lower (compared to 2010-2015. The metros with housing costs of living of 125 and higher experienced deteriorating domestic migration (Figure 4). Annual data is shown in Figure 5.
Millions Abandon High Cost Metros
The largest net domestic migration losses are concentrated in the most expensive metros and the gains are concentrated in the metros with overall average costs of living. But there is more to the story. A number of very low-cost metros are also losing domestic migrants, where weaker economies have driven house prices down relative to the overall cost of living. However, there are favorable signs among the lower cost metros, where more recent data indicates substantial domestic migration gains. As more people spend more time working at home, some of these metros could very well attract additional migrants, which could help their economies improve.
Wendell Cox is principal of Demographia, an international public policy firm located in the St. Louis metropolitan area. He is a founding senior fellow at the Urban Reform Institute, Houston, a Senior Fellow with the Frontier Centre for Public Policy in Winnipeg and a member of the Advisory Board of the Center for Demographics and Policy at Chapman University in Orange, California. He has served as a visiting professor at the Conservatoire National des Arts et Metiers in Paris. His principal interests are economics, poverty alleviation, demographics, urban policy and transport. He is co-author of the annual Demographia International Housing Affordability Survey and author of Demographia World Urban Areas.
Mayor Tom Bradley appointed him to three terms on the Los Angeles County Transportation Commission (1977-1985) and Speaker of the House Newt Gingrich appointed him to the Amtrak Reform Council, to complete the unexpired term of New Jersey Governor Christine Todd Whitman (1999-2002). He is author of War on the Dream: How Anti-Sprawl Policy Threatens the Quality of Life and Toward More Prosperous Cities: A Framing Essay on Urban Areas, Transport, Planning and the Dimensions of Sustainability.
Photo: Dayton, Ohio, within hybrid commuting distance of Columbus, Indianapolis and Cincinnati, by Nyttend via Wikimedia, in Public Domain.


