
Demographia International Housing Affordability rates middle-income housing affordability in 92 major housing markets in eight nations: Australia, Canada, China, Ireland, New Zealand, Singapore, the United Kingdom and the United States). This edition covers the third quarter (September quarter) of 2021.
Assessing Housing Affordability: Sometimes housing affordability is evaluated by simply comparing house prices. However, without consideration of incomes, housing affordability cannot be assessed with any real meaning for potential buyers. Housing affordability is house prices in relation to incomes.
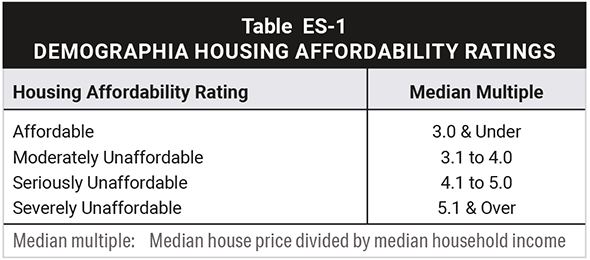 Demographia International Housing Affordability uses the “median multiple” to rate middle-income housing affordability (Table ES-1). The median multiple is a price-to-income ratio, which is the median house price divided by the gross median household income (pre-tax).
Middle-income housing affordability is rated in four categories, ranging from the most affordable (“affordable”) to the least affordable (severely affordable):
Housing markets are metropolitan areas, which are also labor markets. In a well-functioning market, the median priced house should be affordable to a large portion of middle-income households, as was overwhelmingly the case a few decades ago.
Housing affordability comparisons can be made, (1) between housing markets (such as comparison between Adelaide and Melbourne) or (2) over time within the same housing market (such between years in Adelaide).
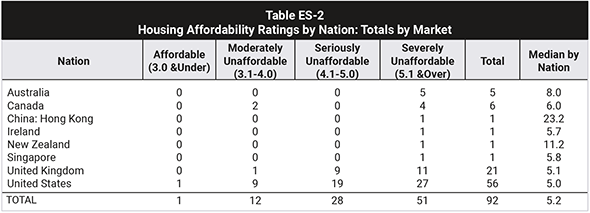
Housing affordability in 2021 is summarized by nation in Table ES-2.
International Housing Affordability in 2021: Housing affordability in 2021 is considerably worse than before, with a five times increase in markets with at median multiples of at 10.0 or more as just a decade ago.
The least affordable market is Hong Kong, with a median multiple of 23.2, followed by Sydney at 15.3, Vancouver at 13.3, San Jose at 12.6 and Melbourne at 12.1. The most affordable market is Pittsburgh, at 2.7, followed by Oklahoma City and Rochester at 3.3, with Edmonton and St. Louis at 3.6.
Housing affordability for all 92 markets is shown by median multiple in Table 4 and by nation in Table 5 (following Section 5 in the report).
Context: The Pandemic Demand Shock: There has been an unprecedented deterioration in housing affordability during the pandemic. The number of severely unaffordable markets rose 60% in 2021 compared to 2019, the last pre-pandemic year.
Lowering the Middle-Income Standard of Living: There is a broad view that declining housing affordability is driving higher costs of living that threaten the future of the middle-class.
In Under Pressure: The Squeezed Middle-Class, the OECD finds that the middle-class faces ever costs of living and that rising owned house prices are the “main driver of rising middle-class expenditure.”
French economist Thomas Piketty’s analysis of growing wealth inequality also evidences the deteriorating standards of living middle-income and lower income households. In the United States more than 85% of cost of living differences between high cost and average cost metropolitan areas are due to housing costs.
Academic research associates the declining housing affordability over recent decades with stronger land use regulation. In particular, urban containment regulation can produce substantially higher costs. In Rethinking Urban Sprawl: Moving Toward Sustainable Cities, OECD concludes that the urban growth boundaries and greenbelts of urban containment must be accompanied by sufficient land for urban expansion to maintain affordability. This land needs to be competitively priced to keep house prices from rising disproportionately to incomes. In housing markets with the least affordable housing, urban containment policy is typical.
Severely Unaffordable Housing: The Ultimate Agglomeration Diseconomy: Economists have long recognized the positive agglomeration economies of urban areas. Yet, more recently, there has been a strong association between falling standards of living and the most stringent land use regulation, especially for those with middle-incomes and low-incomes. The failure to maintain housing affordability may be the ultimate agglomeration diseconomy (negative impacts of larger cities, as opposed to benefits).
Elaboration and sources are in the full report. Click here to read and download the full report.
Wendell Cox is principal of Demographia, an international public policy firm located in the St. Louis metropolitan area. He is a founding senior fellow at the Urban Reform Institute, Houston, a Senior Fellow with the Frontier Centre for Public Policy in Winnipeg and a member of the Advisory Board of the Center for Demographics and Policy at Chapman University in Orange, California. He has served as a visiting professor at the Conservatoire National des Arts et Metiers in Paris. His principal interests are economics, poverty alleviation, demographics, urban policy and transport. He is co-author of the annual Demographia International Housing Affordability Survey and author of Demographia World Urban Areas.
Mayor Tom Bradley appointed him to three terms on the Los Angeles County Transportation Commission (1977-1985) and Speaker of the House Newt Gingrich appointed him to the Amtrak Reform Council, to complete the unexpired term of New Jersey Governor Christine Todd Whitman (1999-2002). He is author of War on the Dream: How Anti-Sprawl Policy Threatens the Quality of Life and Toward More Prosperous Cities: A Framing Essay on Urban Areas, Transport, Planning and the Dimensions of Sustainability.
Photo: La Citta Vita via Flickr under CC 2.0 License.


