
The latest City Sector Model analysis of major metropolitan areas shows that dispersion accelerated in 2020 during the period covered by the American community survey 2020 five- year survey (2016 to 2020). The American Community Survey collects a five year sample that covers virtually all geographies in the United States. The new 2016-2020 sample has an “middle year” of 2018.
The City Sector Model
The Demographia City Sector Model analysis is in its eighth year of publication. Improved data from the American Community Survey made it possible to separate demographic data based on life styles and functions within metropolitan areas in the early 2010s. Before that, nearly all urban, suburban and exurban analysis within metropolitan areas was based on municipal or county jurisdictions. The problem was, however, that nearly all new development since World War II had been lower density, principally single-family houses, while the automobile quickly replaced much of the commuting that had been previously been on transit or on foot.
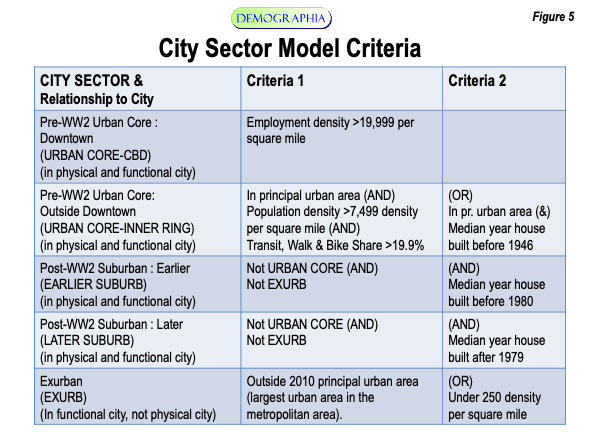
The Demographia City Sector Model classifies zip code residents based upon their population density and extent of automobile commuting into five geographical classifications, as indicated in Figure 5. The intent is to separate the pre-World War II city from the very different city that has developed in the intervening three-quarters of a century.
The formerly monocentric city (metropolitan area), with a large share of workers commuting to downtown, many by transit, has been replaced by a more polycentric, but principally dispersed employment distribution that can be best served by car within the 30 minute commute time most people choose (See: 30-Minute Commute Access: Theoretical and Real).
Where Growth Occurred
The new data indicates an acceleration of suburban and exurban growth.
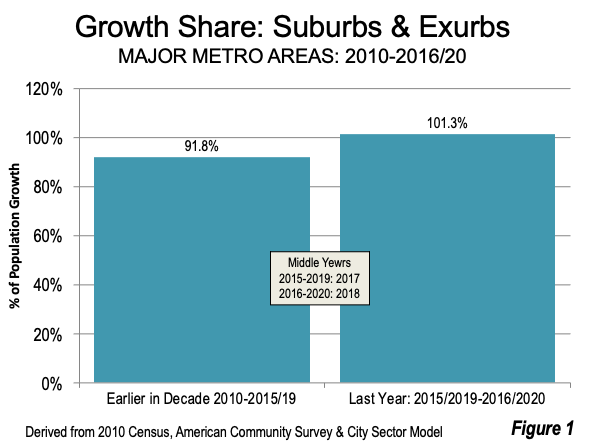
Over the first seven years of the period. From 2010 to the middle year of 2017 (2015/2019 ACS) 92.3% of major metropolitan area growth was in the suburbs and exurbs, and 7.3%the urban core. In the 8th year (2016 to 2020), largely pre-pandemic except for the last few months, 101.3% of the population gain was in the suburbs and exurbs, while the share in the urban cores dropped 1.3% (Figure 1).
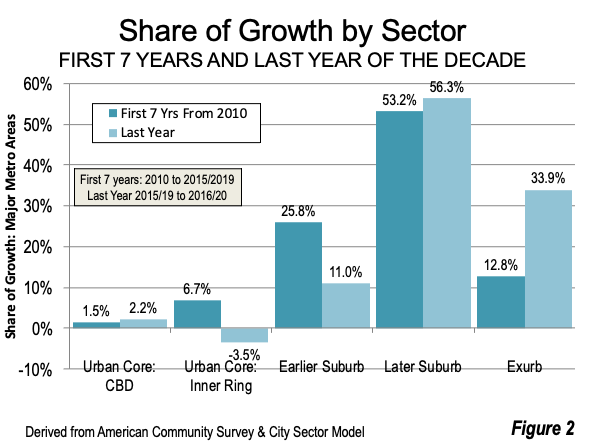
Over the last year, this pattern accelerated with growth overwhelmingly concentrated in the outer suburbs and exurbs:
- The earlier suburbs (inner suburbs, usually more tied to the urban core) experienced a drop in their growth share from 25.8% in the first seven years to 11.0% in the last year.
- The later suburbs (outer suburbs) increased their share from 53.2% in the first seven years, to 56.3% in the last year.
- The exurbs nearly tripled their share of growth, from a 12.8% share in the first seven year to 33.9% in the last year.
- There was also strong growth in the Urban Core-Central Business Districts (CBD), though on a very small base (1.3% of the metropolitan population), from 1.5% in the first seven years to 2.2% in the last year.
This CBD gain was more than made up by the decline or the surrounding Urban Core-Inner Ring, which fell from 6.7% in the first seven years to minus 3.5% in the last year (Figure 2).
Distribution of Major Metropolitan Population
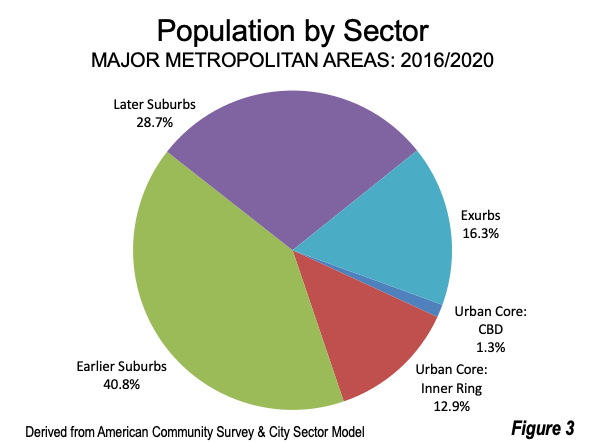
As of the latest data, (ACS 2020 five year), 85.8% of the major metropolitan area population was in the suburbs and exurbs. The urban core, including the CBD and Inner Ring, is characterized by higher density, more commuting by transit and walking, generally older housing and more multifamily housing, contained 14.2% of the population. The suburbs and exurbs thus have nearly six times as much of the population as the urban cores.
The largest share of the metropolitan population continues to be in the earlier suburbs with almost 41% of the population. The later suburbs have 28.7% of the metro population while the exurbs have 16.3% (Figure 3).
Strongest Urban Cores
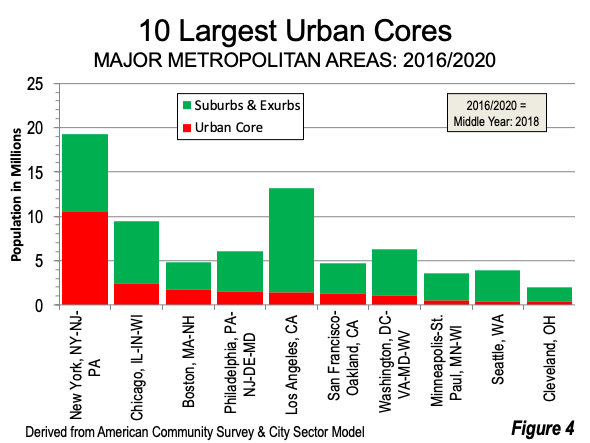
As in other categories, such as transit ridership, and population density, New York is in a class by itself in the strength of its urban core (Figure 4), which comprises 55% of the metropolitan area population. New York’s 10.6 million urban core residents dwarf that of Chicago, where the urban core contains about 2.4 million residents, and 26% of the metro area’s population. Boston has the third largest urban core, at 1.7 million and has by far the second largest urban core in relation to its metropolitan population, at 36%. Philadelphia has the fourth largest urban core, at 1.6 million and 26% of its metro population. Los Angeles has the fifth largest urban core, at 1.5 million, but that represents only 11% of its metropolitan population. San Francisco has 1.3 million urban core residents, 27% of the metro population, which is third ranked after New York and Boston. Washington has more than 1.1 million urban core residents (17% of the population), followed by Minneapolis-St. Paul, Seattle and Cleveland.
Accelerating Pandemic Dispersion
The most recently released county and metropolitan area population estimates indicate additional and huge population losses in the core counties for 2020-2021. The 2020 dispersal, along with increased residential mobility due to hybrid and remote working, could suggest an even greater dominance of future growth in the suburbs and exurbs.
Wendell Cox is principal of Demographia, an international public policy firm located in the St. Louis metropolitan area. He is a founding senior fellow at the Urban Reform Institute, Houston, a Senior Fellow with the Frontier Centre for Public Policy in Winnipeg and a member of the Advisory Board of the Center for Demographics and Policy at Chapman University in Orange, California. He has served as a visiting professor at the Conservatoire National des Arts et Metiers in Paris. His principal interests are economics, poverty alleviation, demographics, urban policy and transport. He is co-author of the annual Demographia International Housing Affordability Survey and author of Demographia World Urban Areas.
Mayor Tom Bradley appointed him to three terms on the Los Angeles County Transportation Commission (1977-1985) and Speaker of the House Newt Gingrich appointed him to the Amtrak Reform Council, to complete the unexpired term of New Jersey Governor Christine Todd Whitman (1999-2002). He is author of War on the Dream: How Anti-Sprawl Policy Threatens the Quality of Life and Toward More Prosperous Cities: A Framing Essay on Urban Areas, Transport, Planning and the Dimensions of Sustainability.
Photo: New York — outer suburbs (New Jersey), by author.


