
The latest final births data (2020) from the Center for Disease Control indicates that the US total fertility rate continued to decline and has reached a record low. The total fertility rate is the number of children that the average woman has during her child-bearing years. In 2020, the US rate was 1.64, well below the 2.10 replacement rate. This is 15 percent below the 2010 rate of 1.93.
Total Fertility Rates by Race and Ethnicity
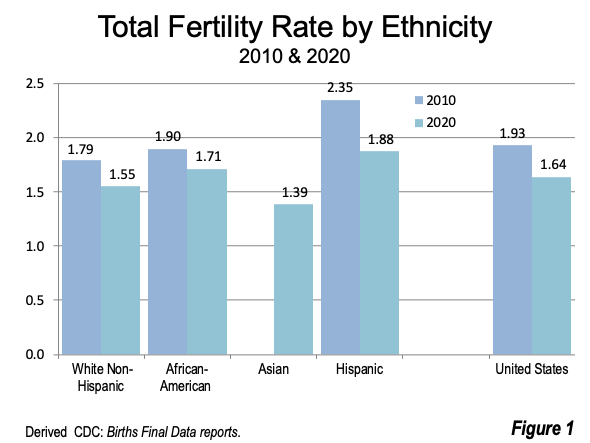
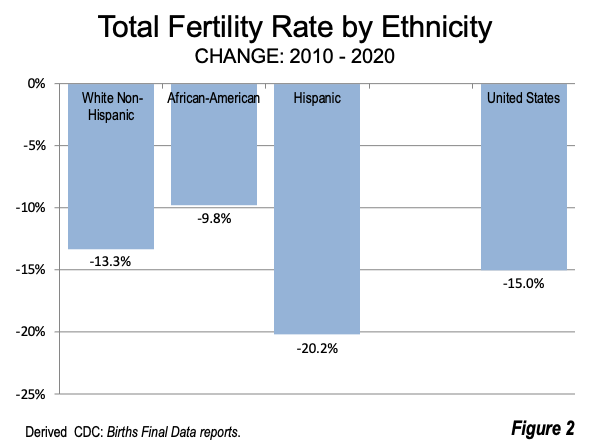
The highest total fertility rate (TFR) was among Hispanics, at 1.88. But this demographic group also experienced a rapid decline, down 20 percent, from 2.35 in 2010. This drop is particularly significant since the Hispanic TFR was well above the replacement rate in 2010, and was seen as one way to keep the country from more rapid aging and population decline.
The other three major races and ethnicities have total fertility rates below replacement. The African-American Non-Hispanic total fertility rate dropped to 1.71, down 10 percent from the 2010 rate.
Among White-Non Hispanics, the 2020 total fertility rate was 1.55, down 13% from the 2010 rate of 1.79.
The lowest total fertility rate was 1.39 among Asian Non-Hispanics. Data is not available Asians in 2010, due to changes in classifications, however since 2016 the Asian rate dropped from 1.69 in 2016, a drop of 18%. This decline was more than the White and Black Non-Hispanic declines for 10 years and was nearly as much as the Hispanic 10-year decline (Figures 1 & 2).
Total Fertility Rates by State & DC
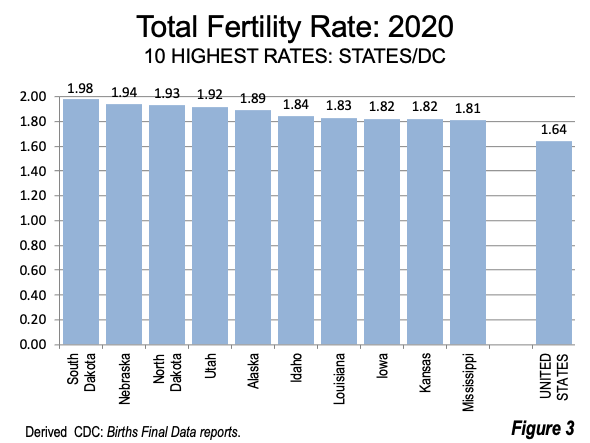
Five of the ten states with the highest TFRs are adjacent, including South Dakota, Nebraska, North Dakota, Iowa and Kansas.
South Dakota has the highest total fertility rate among the states and DC, at 1.98. This is 0.12 points below replacement and indicates that all states and DC are below replacement. The second highest TFR is in Nebraska, at 1.94, followed by North Dakota, at 1.93.
Utah, which for many years had the highest fertility in the nation, ranked fourth highest, at 1.92. Alaska ranked fifth, at 1.89. Idaho, Louisiana, Iowa, Kansas and Mississippi also had among the 10 highest TFRs (Figure 3).
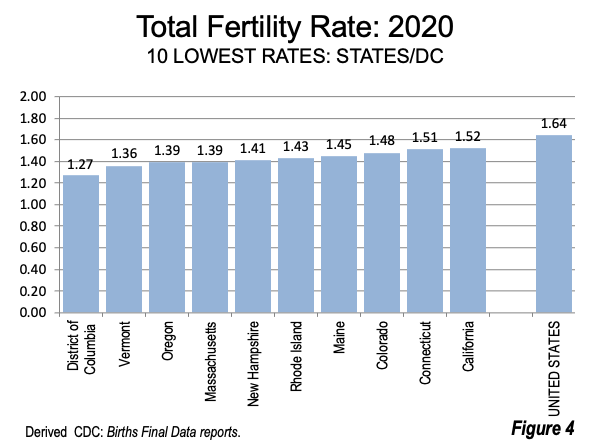
The lowest TFRs are concentrated in New England and the West. All six New England states are among those with the ten lowest TFRs, while three states are in the West.
The District of Columbia had the lowest TFR, at 1.27, well below the second lowest, Vermont, with a TFR of 1.36. The very low TFR in DC is to be expected, since it does not have the more diverse demographics of a state, which typically have large numbers of households in rural and suburban areas, as well as urban cores. DC is a part of the Washington metropolitan area, but has no suburban or rural areas, and historically has attracted young often single people.
Vermont, Oregon and Massachusetts, which have the second to fourth lowest TFRs, all have rates under 1.40. New Hampshire, Rhode Island, Maine and Colorado have TFRs between 1.40 and 1.49. Connecticut and California have the 9th and 10th lowest TFRs (Figure 4).
Changes by State & DC: 2010-2020
Overall, the US TFR declined 15 percent from 2010 to 2020. Every state and DC experienced a TFR decline.
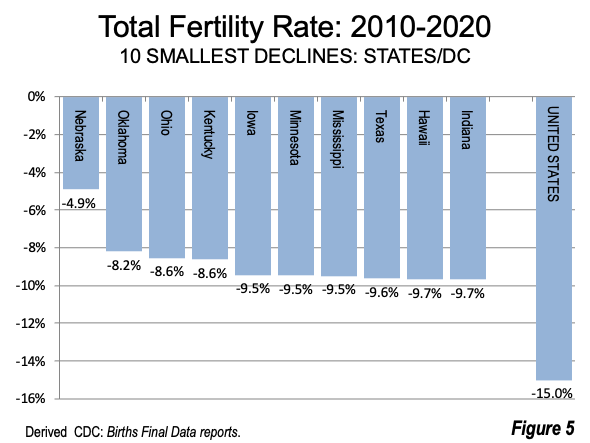
States with the smallest TFR declines Among the 10 states with the smallest TFR declines from 2010 to 2020, nine are in what is considered “flyover” country, or the middle of the nation. These states are joined by the mid-Pacific exclave of Hawaii.
Nebraska had the least decline, at minus 4.9%. Oklahoma, Ohio and Kentucky had the second to fourth smallest TFR decline, at between minus eight and nine percent. While metropolitan area total fertility rates are not included, this would suggest that the Cincinnati metropolitan area, which is principally located in Ohio and Kentucky, would rank high if such data were available.
Iowa, Minnesota, Mississippi, Texas, Hawaii and Indiana round out the top 10, at between minus nine and ten percent. Moreover, part of the Cincinnati metropolitan area stretches into Indiana. Eleventh ranked North Dakota also registered a TFR decline of under 10 percent (Figure 5).
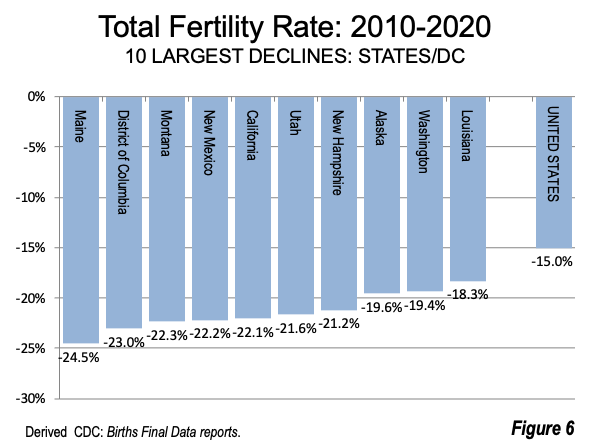
States/DC with the largest TFR declines: Six of the 10 states/DC with the largest TFR declines from 2010 to 2020 are in the West, and Alaska.
However, New England’s Maine had the largest TFR decline, dropping 25 percent from 2010 to 2020. The District of Columbia had the second largest decline, at 23 percent. Montana, New Mexico and California were between a 22 and 23 percent loss. Utah and New Hampshire had losses of 21 percent. Utah’s loss is particularly significant, given its historically high fertility. Alaska and Washington had 10 year losses of 19 percent. Louisiana had the 10th largest TFR loss, at 18% (Figure 6).
US Fertility Rates: From High to European?
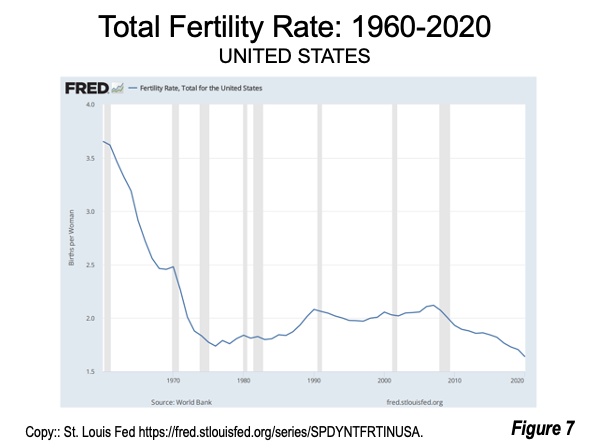
The 2020 US 1.64 TFR is the lowest in history, the nation has been below replacement rate fertility for most of the last 50 years (Figure 7). Indeed, a previous low point was reached in 1976, at 1.76. Briefly, replacement rate was achieved in the late 2000.
There may have been a perception that America’s TFRs was materially more positive than other highly developed nations. Certainly, due to immigrants and a slightly higher birthrate, the US demographics looked less threatening than those in Europe or East Asia. But now we seem to be falling down towards European levels; the US is below France (1.79) and Sweden (1.67) but ahead of Germany (1.52) and the United Kingdom (1.56). However, the US TRF is still well ahead of Japan (1.29), South Korea (0.89), Singapore (1.00) and China (1.28).
For now, American demographics still seem slightly better than our major rivals, but the gap is closing with remarkable rapidity.
Wendell Cox is principal of Demographia, an international public policy firm located in the St. Louis metropolitan area. He is a founding senior fellow at the Urban Reform Institute, Houston, a Senior Fellow with the Frontier Centre for Public Policy in Winnipeg and a member of the Advisory Board of the Center for Demographics and Policy at Chapman University in Orange, California. He has served as a visiting professor at the Conservatoire National des Arts et Metiers in Paris. His principal interests are economics, poverty alleviation, demographics, urban policy and transport. He is co-author of the annual Demographia International Housing Affordability Survey and author of Demographia World Urban Areas.
Mayor Tom Bradley appointed him to three terms on the Los Angeles County Transportation Commission (1977-1985) and Speaker of the House Newt Gingrich appointed him to the Amtrak Reform Council, to complete the unexpired term of New Jersey Governor Christine Todd Whitman (1999-2002). He is author of War on the Dream: How Anti-Sprawl Policy Threatens the Quality of Life and Toward More Prosperous Cities: A Framing Essay on Urban Areas, Transport, Planning and the Dimensions of Sustainability.
Photograph: Metropolitan area spanning three of the ten states with the highest TFRs in the US: Downtown Cincinnati from Newport, Kentucky (across the Ohio River). By Author


