
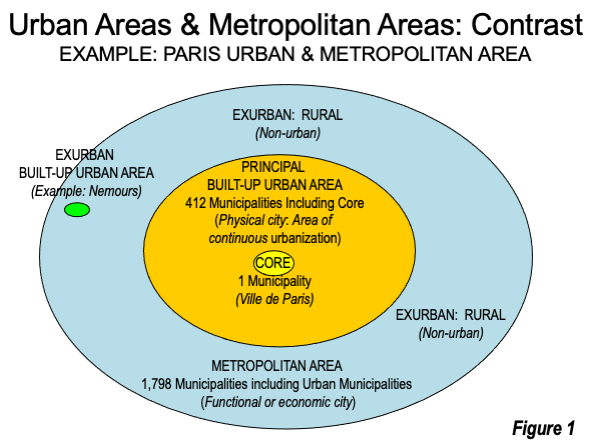
Canada and the United States are among a minority of national governments that formally designate metropolitan areas. Metropolitan areas are labor and housing markets which include a core urban area (built up or developed area) as well as rural territory from which workers commute in large numbers to jobs in the urban area. The concept is illustrated in Figure 1, which uses Paris as an example. Other countries, such as Japan, Brazil, and France also formally designate metropolitan areas.
Metropolitan Areas: More Rural than Urban
Usually the land area of metropolitan areas is overwhelmingly rural, with only a small portion being in the core urban area. According to data from the 2021 census, 87% of the land area in Canada’s metropolitan areas was rural, with only 13% being urban development. Similarly, the data from the 2010 Census indicated that 81% of the land in US major metropolitan areas was rural, with only 19% being urban development. The Paris metropolitan area was 83% rural and 17% urban in the early 2010s.
This article compares Canadian and US major metropolitan areas (1,000,000 plus population) analyzing the last five years of available data (2017 to 2022). In 2022, 190 million people lived in the major metropolitan areas of the United States, while 18.5 million lived in Canada’s metropolitan areas (“census metropolitan areas”). Thus, about 10 times as many people live in major US metropolitan areas as in Canada. Moreover, there are 56 major metropolitan areas in the United States and six in Canada, a similar 10 to 1 ratio.
The Largest Metropolitan Areas
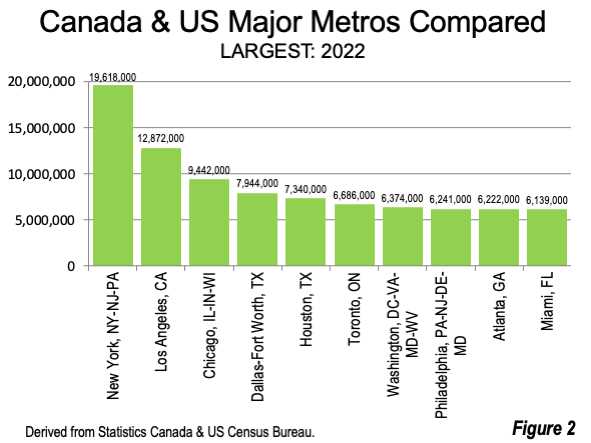
The largest metropolitan area in Canada or the United States is New York, with a population of 19.6 million in 2022. Los Angeles is second, at 12.8 million. Chicago is third at 9.4 million and has been losing population in recent years, raising questions about whether the metropolitan area will ever achieve megacity status (10 million). Dallas-Fort Worth ranks 5th, at 7.9 million, with nearby Houston at 7.3 million. Toronto is the only Canadian metropolitan area ranking in the top 10, with a population of 6.7 million (Figure 2).
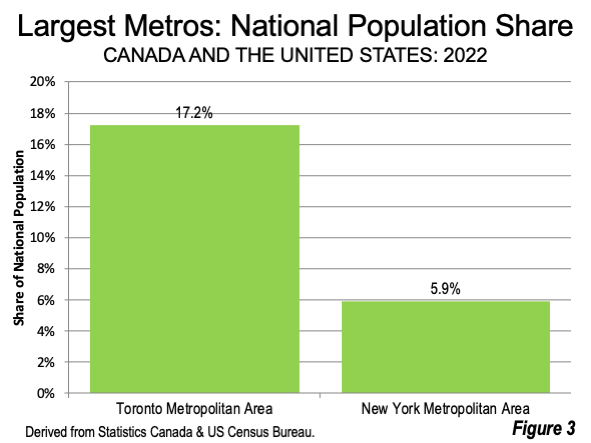
Measured in population, Toronto is more significant in relation to Canada than New York is to the United States. The Toronto metropolitan area has 17.3 percent of Canada’s population. The New York metropolitan area has 5.8% of the US population, two-thirds less of the national population share than Toronto (Figure 3).
Population Gains and Losses
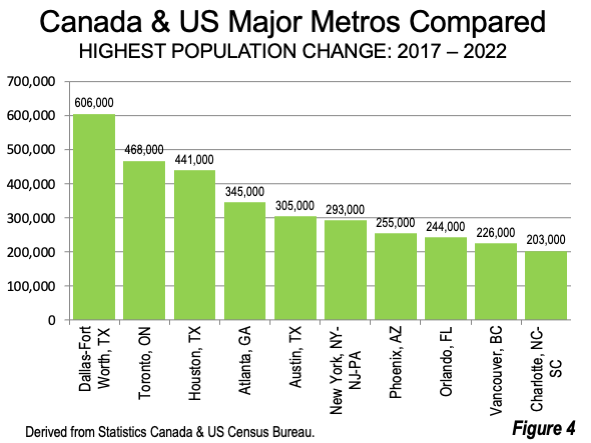
Dallas-Fort Worth is the fastest growing major metropolitan area in the two nations, adding 606,000 new residents in the last five years. Toronto was the second fastest growing metropolitan area, adding 468,000 residents. The Dallas-Fort Worth annualized growth rate was 1.60% from 2017 to 2022, slightly above the Toronto rate of 1.46%. Over the last year (2021-2022), Dallas-Fort Worth retained the lead, adding 170,000 residents compared to Toronto’s 138,000 and retaining its slim lead in percentage population gain of 2.19% to 2.11%.
Houston was close behind Toronto, at 441,000. Atlanta, Austin, New York, and Phoenix gained more than 250,000. Vancouver was the second Canadian metropolitan area in the top ten, ranking ninth, with an increase of 226,000 (Figure 4).
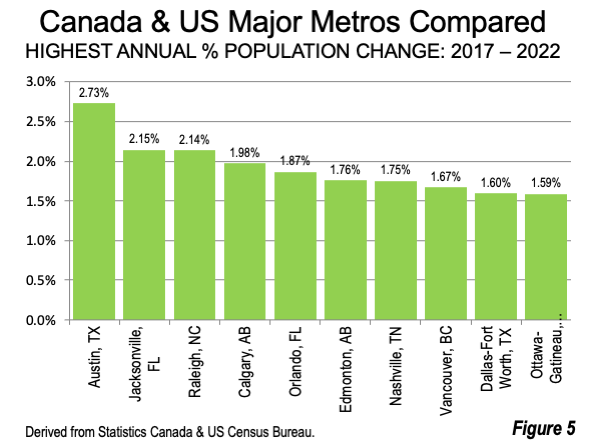
Four Canadian metropolitan areas ranked among the top ten in percentage growth. Austin had largest percentage population increase from 2017 to 2022 at an annual rate of 2.77%. Jacksonville and Raleigh followed Austin. Calgary was the highest ranking Canadian metropolitan area, ranked fourth, with a annual population growth rate of 1.98%. Orlando gained 1.87%. Edmonton ranked sixth with a 1.76% rate, followed by Nashville, at 1.75%. Vancouver ranked eighth at 1.67%, Dallas-Fort Worth, at 1.60% and Ottawa-Gatineau ranked 10th at 1.59% (Figure 5). Toronto, Canada’s largest metropolitan area, ranked 12th in percentage population growth, at 1.46% annually.
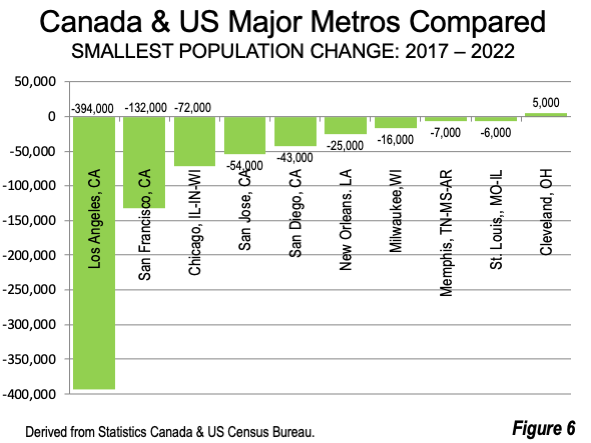
California accounted for four of the five largest population losses. Los Angeles lost 394,000 people between 2017 and 2022. This is a stunning result for metropolitan area that had grown quickly for decades. San Francisco lost the second largest population loss (132,000), while Chicago lost 72,000. San Jose and San Diego had the fourth and fifth largest population losses. No Canadian metropolitan areas were among the those with the smallest gains (Figure 6).
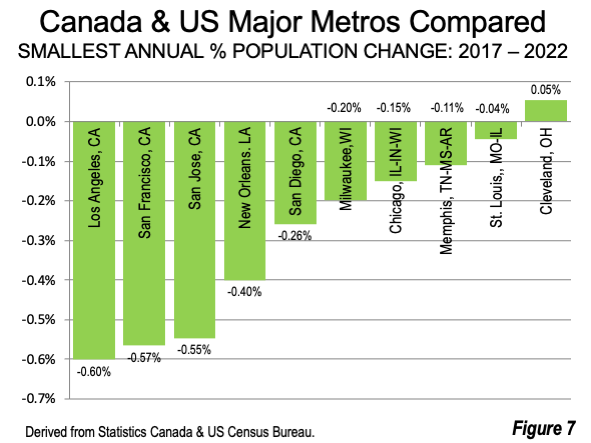
California similarly dominated the lowest percentage population changes. Los Angeles had an annual population loss rate of 0.60%. San Francisco’s loss rate was 0.57% and the San Jose loss rate was 0.57%, New Orleans lost 0.40% annually. San Diego lost 0.26%. No Canadian metropolitan areas were in the bottom 10 in percentage change (Figure 7).
Prospects
According to Statistics Canada, Canada was the fastest growing G-7 nation in 2022, and had a 2.7% annual growth rate in calendar 2023. This was the first year that Canada added more than one million residents in its history (1,050,000). Meanwhile, population growth was significantly muted in the United States in calendar year 2023, adding 1.571 million residents, with a growth rate of only 0.5%. One factor was Canada’s increased immigration targets.
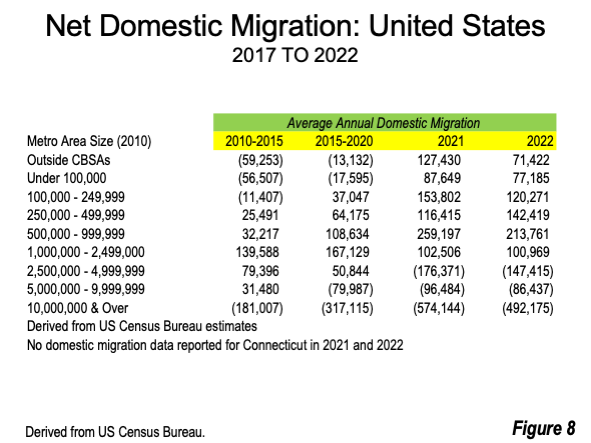
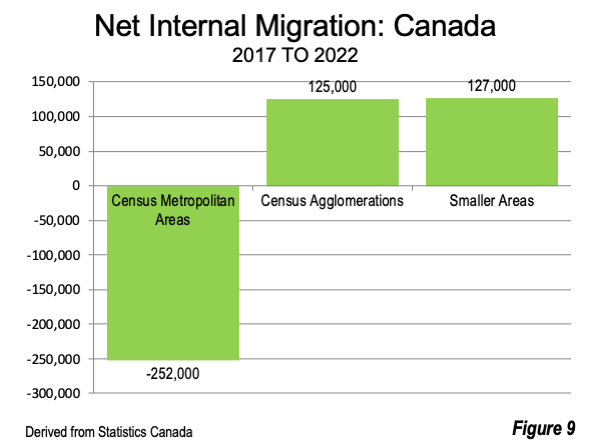
But both countries are experiencing a significant movement of people out of the larger metropolitan areas to smaller areas and even rural areas. In the United States (Figure 8), domestic migration has shifted strongly away from the largest metropolitan areas (with some notable exceptions, such as Dallas-Fort Worth, Houston, and Phoenix). In Canada, the census metropolitan areas (over 100,000 population) lost a net 252,000 internal migrants from 2017 to 2022. while the census agglomerations (populations from 10,000 to 100,000) gained 125,000. The big surprise was that the largest gain was in the under 10,000 category, where the gain was 127,000 (Figure 9). Both national trends are in contrast to nearly opposite trends before the middle of the last decade.
Wendell Cox is principal of Demographia, an international public policy firm located in the St. Louis metropolitan area. He is a founding senior fellow at the Urban Reform Institute, Houston, a Senior Fellow with the Frontier Centre for Public Policy in Winnipeg and a member of the Advisory Board of the Center for Demographics and Policy at Chapman University in Orange, California. He has served as a visiting professor at the Conservatoire National des Arts et Metiers in Paris. His principal interests are economics, poverty alleviation, demographics, urban policy and transport. He is co-author of the annual Demographia International Housing Affordability Survey and author of Demographia World Urban Areas.
Mayor Tom Bradley appointed him to three terms on the Los Angeles County Transportation Commission (1977-1985) and Speaker of the House Newt Gingrich appointed him to the Amtrak Reform Council, to complete the unexpired term of New Jersey Governor Christine Todd Whitman (1999-2002). He is author of War on the Dream: How Anti-Sprawl Policy Threatens the Quality of Life and Toward More Prosperous Cities: A Framing Essay on Urban Areas, Transport, Planning and the Dimensions of Sustainability.
Photo: Peace Arch, Blain, Washington and Surrey, British Columbia. By U.S. Embassy and Consulate, via Flickr, in public domain.


