
For more than a century, people have been moving by the millions to larger urban areas from smaller urban areas and rural areas. Within the last five years, the share of the world population living in rural areas has dropped below one-half for the first time. The migration to the larger urban areas has spread to lower income nations as the countryside seemingly empties into places like Chongqing, Jakarta and Delhi. In the United States, the rural population has declined from slightly more than 60% in 1900 to approximately 18% in 2010. In Australia, the rural population is expected to decline to below 10% later in this decade.
Of course, the driving factor in this urban migration is the quest for opportunity. People have flocked to urban areas because opportunities are greater.
Yet if the opportunities are in metropolitan areas, indications are that this is taking place over a wider area than in the past. A review of income growth between 2001 and 2006 in four nations shows that incomes rose more in some surrounding regions than within the metropolitan areas, at least during the first half of the decade. It will be interesting to see if these patterns have changed in the second half of the decade, something we will be able to discern once the 2010/2011 round of census data is available.
Australia
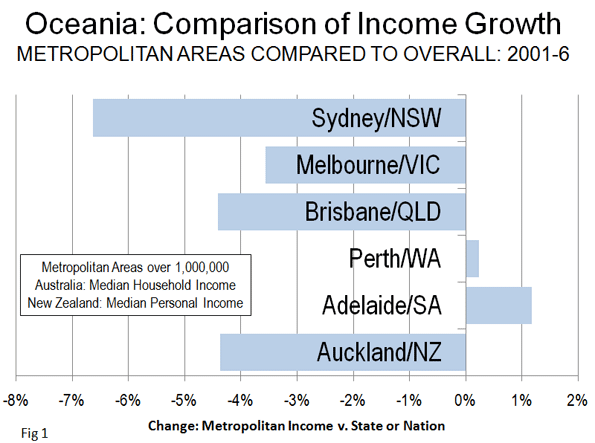
This dispersion of opportunity is particularly evident in Australia, where data from the last two national censuses indicates that incomes overall have risen more quickly outside some major metropolitan areas. In three of five cases (the three largest) incomes rose higher outside rather than inside the major metropolitan areas (Figure 1).
- In Sydney, the largest metropolitan area in Australia, median household incomes declined 6.6% relative to those of the state of New South Wales.
- Melbourne median household incomes declined 3.5% relative to those of the state of Victoria.
- Brisbane median household incomes declined 4.4% relative to those of the state of Queensland.
- Median household incomes in Perth rose marginally more than those in the state of Western Australia (0.2%), while Adelaide incomes rose the strongest against state (South Australia) incomes at 4.4%.
New Zealand
Mimicking the largest metropolitan areas in Australia, Auckland, New Zealand's largest metropolitan area, experienced a median personal income loss of 4.4% relative to that of the nation between 2001 and 2006 (Figure 1).
Canada
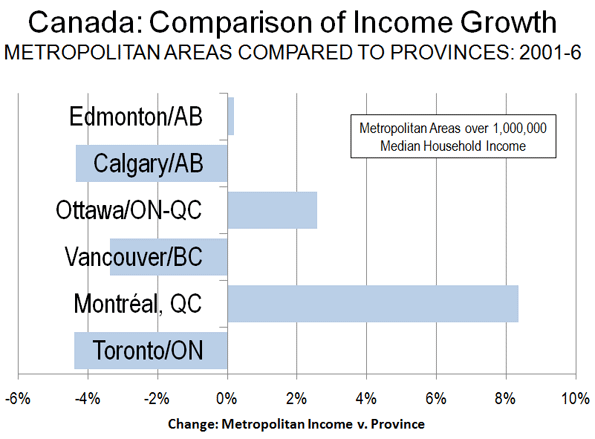
A similar story has unfolded in Canada. Major metropolitan area median household incomes declined relative to provincial incomes in one half of the cases (Figure 2). The largest relative losses occurred in arguably two most dynamic metropolitan areas :
- Toronto, which accounts for nearly one fifth of Canada's population experienced a median household income decrease of 4.4% relative to that of the province of Ontario. Steve LeFluer's recent article shows that within the Greater Toronto area, the core city, with its amalgamated inner suburbs, has the lowest median household income.
- Calgary, Canada's energy capital, also experienced a median household income decrease of 4.4% relative to its province, Alberta.
Vancouver's median household income also fell, 3.3% relative to that of British Columbia's.
Three metropolitan areas experienced faster economic growth:
- By far the strongest growth income growth occurred in Montréal, where median household incomes increased 8.4% relative to incomes in Québec.
- The nation's capital, Ottawa (a metropolitan area that straddles the borders of Ontario and Québec) experienced a median household income increase of 2.6% relative to the weighted median of the two provinces.
- Edmonton, Alberta's capital, experienced income growth marginally above that of the province (0.2%).
United States
A review of data in the United States indicates similar results. The same time span (2001 to 2006) was analyzed for the 34 metropolitan areas with more than 1 million population that are in a single state. State personal incomes per capita rose at a greater rate than the metropolitan area rates in 18 of the 34 cases (Figure 3).
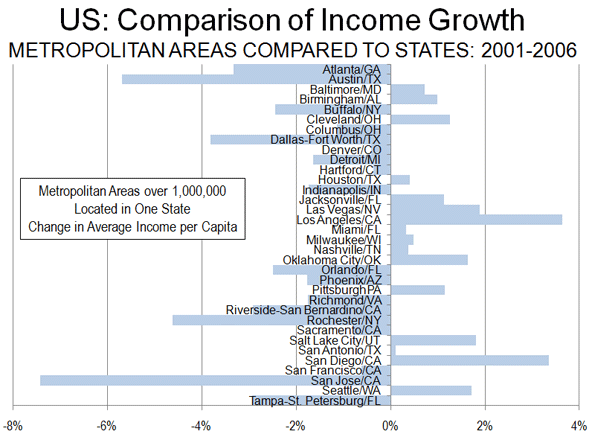
Two California metropolitan areas performed the best. In Los Angeles personal income per capita rose 3.6% relative to that of California in San Diego, per capita income rose at 6% relative to that of the state.
Other metropolitan areas, including Las Vegas, Salt Lake City, Seattle, Oklahoma City, Cleveland, Pittsburgh and Jacksonville experienced income per capita increases of between 1% and 2% relative to those of their respective states.
The largest loss occurred in information technology intensive San Jose, where incomes dropped 7.4% relative to those of California. Austin, capital of the nation's second-largest state, experienced the second largest drop at 5.7% relative to incomes in the state of Texas, which as one of the leading information technology centers in the nation, generally mirrors the San Jose performance.
Other losses between 2% and 5% relative to their states occurred in Rochester, Dallas-Fort Worth, Atlanta, Tampa-St. Petersburg, Riverside-San Bernardino, Orlando and Buffalo.
Among the 15 multi-state metropolitan areas, eight experienced income increases relative to the states in the largest share of the population lives (this state with the historical core municipality) and seven declined. Perhaps the most surprising finding is that two metropolitan areas (New York and Washington), which have been among the most consistent in providing economic opportunities experienced only modestly greater income growth than their states.
- New York, one of the two or three principal financial centers of the world, experienced income growth only 0.6% relative the weighted average of the states of New York and New Jersey, where nearly all of the area is located (Pike County, Pennsylvania is also in the metropolitan area).
- Washington, where federal government and related in one can be counted upon to produce income growth, experienced only a modest rise of 0.3% relative to the weighted average of the two states (Virginia and Maryland) that comprise nearly all of the metropolitan area (Jefferson County, West Virginia is also in the metropolitan area).
Metropolitanizing the World?
These trends suggest a shift in metropolitan fortunes, at least in advanced countries. Historically incomes have grown much more strongly in metropolitan areas than in other areas. Now incomes are rising more quickly or at least nearly as quickly outside some major metropolitan areas as they are inside. It can no longer be blithely assumed that large metropolitan areas experience greater economic growth than their less urban hinterlands. The differences may be fading away, shaped not so much by proximity to the core but by other regional factors.
We currently can only speculate as to the reasons for this development. The expansion of personal mobility and the ability of people to commute from outside major metropolitan areas may be one reason. Perhaps the most important factor is the rise of the information economy, which has freed some people from more intense urban living by permitting working at home part or all of the time. The proliferation of shopping opportunities, through franchised chains, the outward movement of immigrants, and online ordering may have made formerly remote areas more able to fulfill the needs and desires of people who previously would have inclined to live in more urban surroundings.
These developments are consistent with the net migration of more than 2 million people away from metropolitan areas of more than 1 million population between 2000 and 2009 in the United States. Further, the phenomenon may be spreading beyond the high income world. As recently noted, in China, economic opportunities may be expanding in rural areas.
------
Note
This analysis compares metropolitan incomes to incomes in larger political jurisdictions (such as the metropolitan area of San Diego and California). An analysis that compared the area within the larger jurisdiction, but outside the metropolitan area, would yield a somewhat a difference (whether higher or lower), because the larger jurisdiction data available includes the metropolitan areas.
Photo: "Outback" New South Wales: Faster Income Growth than Sydney (by author)
Wendell Cox is a Visiting Professor, Conservatoire National des Arts et Metiers, Paris and the author of “War on the Dream: How Anti-Sprawl Policy Threatens the Quality of Life”


