
The 2011 state population estimates released earlier today by the Census Bureau show that the South has retained its dominant position in both population and growth over the last year. Southern states accounted for more than one half of the nation's population growth between 2011 and 2000, despite having little more than one third of the population. Moreover, the South was the recipient of 95% of the inter-regional net domestic migration (people moving from one state to another), with the West accounting for the other 5%, with the losses split between the Northeast and the Midwest.
Overall, a net 533,000 people moved from one state to another, somewhat above the low of 503,000 in 2008 and below the 573,000 at the beginning of the previous decade (2001). The figure, however, remained less than one-half that of the mid 2000s peak.
The state data confirmed the "return to normalcy," that had been indicated by the 2010 American Community Survey data.
The South Rises Again
In 2011 (July 2010 to June 2011), seven of the top domestic migration gaining states were in the South. This is a restoration of the same dominance the South achieved in 2001 to 2006. Some of the states have changed, but the overall impact is little different.
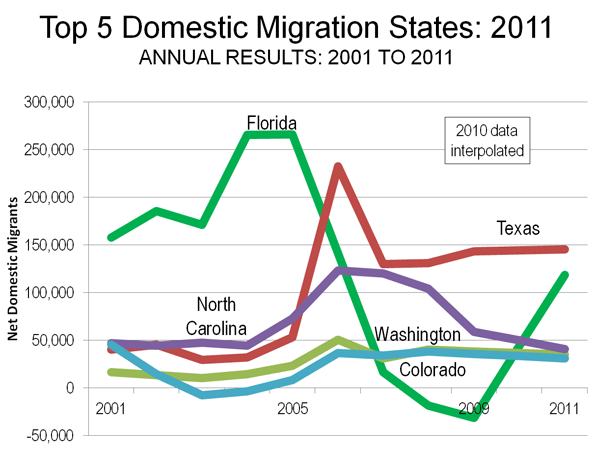
Texas:Texas again led the nation in net domestic migration, adding 145,000 people from other states to its population. This was a slight increase from the 143,000 net domestic migrants in 2009 (Note 1) and was the highest for Texas since the artificially intense exodus from Louisiana in the year (2006) following hurricanes Katrina and Rita. Texas has led the nation in net domestic migration for six years and ranked second in the nation over the 2001 to 2009.
Florida: Most spectacularly, however, has been the performance of Florida. Florida had been a net domestic migration leader for years, and had been number one from 2001 through 2005. However, when its highly inflated house prices collapsed (New York Federal Reserve Bank research refers to Florida as one of the "four bubble" states, along with California, Arizona and Nevada), Florida lost domestic migrants for the first time in at least six decades, in both 2008 and 2009. That has been radically turned around. In 2011, Florida added 119,000 net domestic migrants, housing prices dropped to normal levels (Note 2). While this is less than one half the gains in 2004 and 2005, it exceeds the annual Texas increase in the previous decade by 20%.
North Carolina and South Carolina: North Carolina ranked third, adding 41,000 net domestic migrants. This is an improvement from a fourth-place ranking in the previous decade. Neighboring South Carolina added 22,000 net domestic migrants and ranked sixth. This is an improvement from the previous decade's ranking of seventh. The domestic migrants to North Carolina and South Carolina have been called "halfbacks," as some have suggested that many who had moved to Florida from the Northeast have subsequently moved to North Carolina and South Carolina, essentially one half of the way back to where they moved from originally.
Tennessee, Georgia and Virginia: Tennessee (7th), Georgia (8th) and Virginia (9th) rounded out the South's seven of the top 10 states. Tennessee improved from having been 8th in 2001 to 2009, while Georgia dropped from 5th and Virginia was a new entrant, having previously ranked 12th.
Western Runners-Up
While the West continued to show net domestic migration gains, this formerly fastest-growing area of the nation has fallen well behind.
Washington: Washington ranked fourth in 2011, an improvement from ninth between 2001 and 2009. Washington added 35,000 net domestic migrants.
Colorado: Colorado also improved its position, adding a net 31,000 domestic migrants and ranking fifth in 2011, which is up from its 10th ranking in 2001 through 2009.
Oregon:Oregon ranked 10th, adding 14,000 net domestic migrants and was a new entrant to the top 10, having placed 11th between 2001 and 2009.
Things Never Change: The Bottom 10
A similar restoration of normalcy is evident in the bottom 10 states. From 2001 to 2009, all of the bottom 10 net domestic migration states were in the Northeast or the Midwest, joined by California. This changed somewhat in 2011, with formerly fast-growing Nevada, edging out one of the former bottom 10. There was some movement at the very bottom of the list.
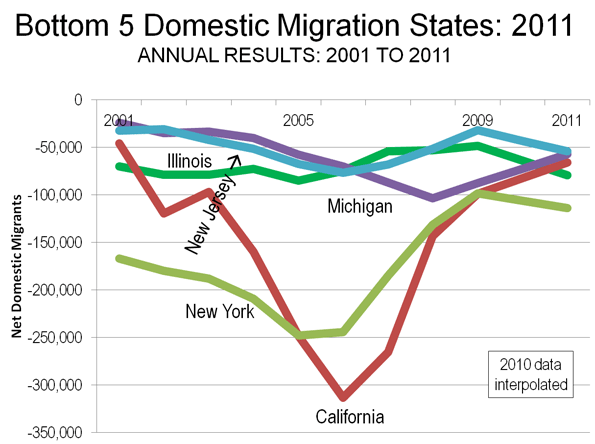
New York: New York recovered its last place position (51st), which it held overall between 2001 and 2009, but had yielded to California later in the decade. New York lost 114,000 net domestic migrants in 2011, which compares to the 1,650,000 loss between 2000 and 2009.
Illinois:Illinois had the second-highest net domestic migration loss, sending 79,000 of its residents to other states. Illinois had ranked 49th in net domestic migration in the previous decade, with a 615,000 loss. Unlike the other biggest losers, New York and California, the Illinois rate in the single year of 2011 exceeded its annual rate of net domestic migration loss between 2000 and 2009.
California:The bad news is that California continues to be among the most hemorrhaging states in net domestic migration. The 2000 to 2009 net domestic migration loss of 1,500,000 was more than the population of the cities (municipalities) of San Francisco and Sacramento combined. Perhaps it is good news that the net domestic migration loss dropped to 66,000 in 2011, less than half the annual rate in the previous decade. California ranked 49th in net domestic migration in 2011, an improvement from its 50th place position in 2001 through 2009.
Michigan: Michigan continued its heavy losses, losing a net 57,000 domestic migrants in 2011 and ranking 48th. In the previous decade, Michigan had also ranked 48th and had a net loss of more than 535,000 domestic migrants.
New Jersey, Ohio and Connecticut: New Jersey, Ohio and Connecticut occupied the next three higher positions in the bottom ten. The New Jersey and Ohio ranks of 47th and 46th were the same as in the previous decade. Connecticut ranked 45th in 2011 and had ranked 42nd, at the top of the bottom 10, in the previous decade. Each of these states experienced an acceleration of net domestic outmigration relative to their annual loss in the previous decade. In the previous decade, the New Jersey and Connecticut losses had been driven by the New York metropolitan area, which suffered the preponderance of the net domestic migration losses in the Northeast.
Missouri and Indiana: The Midwestern states of Missouri and Indiana were new entrants to the bottom 10. Missouri ranked 44th in net domestic migration in 2011, losing 12,000, a substantial deterioration from its 20th ranking in the previous decade when the state added 41,000 residents from other states. Indiana ranked 43rd compared to its 32nd place ranking in the previous decade.
Nevada: Nevada, which had ranked sixth in net domestic migration in the previous decade, occupied the top position in the bottom 10, at 42nd. Nevada lost 11,000 domestic migrants, compared to a gain of more than 360,000 in the previous decade. Like Florida, house prices had escalated sharply during the housing bubble and prices have since fallen back to normal levels. However, much of Nevada's economy is tied to that of California, which could be a hindrance to the restoration of its previous growth.
Other Notes
The other "bubble state," Arizona ranked 11th in net domestic migration, adding 13,000 new residents from other states. As in Florida, house prices had escalated sharply but have since fallen back to normal levels. However, despite its healthy domestic migration, Arizona's gain is far less than its annual rate in the previous decade.
There are nothing but surprises in the balance of the top 15. Oklahoma, which has long exported people, especially to the West, ranked 12th in net domestic migration, an improvement from 19 in the previous decade. The District of Columbia ranked 13th, which is a strong improvement from its previous ranking of 37th. Louisiana continued its recovery, ranking 14th, which is an improvement from 45th in the previous decade. North Dakota, whose 2000 population was less than that of 1920, ranked 15th, which is an improvement from 31th in the previous decade.
No Matter How Much Things Change They Stay the Same
Both over the last decade and in 2011, the South accounted for 53% of the nation's growth, the West 32%, with the Midwest rising from 8% to 9% and the Northeast falling from 7% to 6%. And, as indicated above, net domestic migration results were similar. The conclusion from the new census estimates is consistent with the old adage that "no matter how much things change, they stay the same."
| Net Domestic Migration by State: | ||||
| 2001-2009 and 2011 | ||||
| By 2011 Rank | ||||
| State | 2011 | 2011 Rank | 2001-2009 | 2001-2009 Rank |
| Texas | 145,315 | 1 | 838,126 | 2 |
| Florida | 118,756 | 2 | 1,154,213 | 1 |
| North Carolina | 41,033 | 3 | 663,892 | 4 |
| Washington | 35,166 | 4 | 239,037 | 9 |
| Colorado | 31,195 | 5 | 202,735 | 10 |
| South Carolina | 22,013 | 6 | 306,045 | 7 |
| Tennessee | 20,328 | 7 | 259,711 | 8 |
| Georgia | 17,726 | 8 | 550,369 | 5 |
| Virginia | 15,538 | 9 | 164,930 | 12 |
| Oregon | 13,636 | 10 | 177,375 | 11 |
| Arizona | 13,150 | 11 | 696,793 | 3 |
| Oklahoma | 8,933 | 12 | 42,284 | 19 |
| District of Columbia | 8,334 | 13 | (39,814) | 37 |
| Louisiana | 7,085 | 14 | (311,368) | 45 |
| North Dakota | 6,368 | 15 | (18,071) | 31 |
| Kentucky | 5,761 | 16 | 81,711 | 15 |
| Arkansas | 5,724 | 17 | 75,163 | 16 |
| Montana | 3,888 | 18 | 39,853 | 21 |
| West Virginia | 2,814 | 19 | 17,727 | 26 |
| South Dakota | 2,610 | 20 | 7,182 | 27 |
| Delaware | 2,347 | 21 | 45,424 | 18 |
| New Mexico | 2,202 | 22 | 26,383 | 24 |
| Alabama | 1,974 | 23 | 87,199 | 14 |
| Alaska | 740 | 24 | (7,360) | 29 |
| Wyoming | (149) | 25 | 22,883 | 25 |
| Idaho | (256) | 26 | 110,279 | 13 |
| Utah | (826) | 27 | 53,390 | 17 |
| Vermont | (841) | 28 | (1,505) | 28 |
| Nebraska | (977) | 29 | (39,275) | 36 |
| Maine | (1,000) | 30 | 29,260 | 23 |
| Pennsylvania | (1,121) | 31 | (33,119) | 34 |
| Iowa | (1,361) | 32 | (49,589) | 40 |
| Hawaii | (2,320) | 33 | (29,022) | 33 |
| Maryland | (2,994) | 34 | (95,775) | 43 |
| New Hampshire | (3,645) | 35 | 32,588 | 22 |
| Rhode Island | (6,273) | 36 | (45,159) | 38 |
| Mississippi | (6,672) | 37 | (36,061) | 35 |
| Kansas | (7,928) | 38 | (67,762) | 41 |
| Minnesota | (8,073) | 39 | (46,635) | 39 |
| Massachusetts | (10,886) | 40 | (274,722) | 44 |
| Wisconsin | (10,990) | 41 | (11,981) | 30 |
| Nevada | (11,113) | 42 | 361,512 | 6 |
| Indiana | (11,412) | 43 | (21,467) | 32 |
| Missouri | (11,831) | 44 | 41,278 | 20 |
| Connecticut | (16,848) | 45 | (94,376) | 42 |
| Ohio | (44,868) | 46 | (361,038) | 46 |
| New Jersey | (54,098) | 47 | (451,407) | 47 |
| Michigan | (57,234) | 48 | (537,471) | 48 |
| California | (65,705) | 49 | (1,490,105) | 50 |
| Illinois | (79,458) | 50 | (614,616) | 49 |
| New York | (113,757) | 51 | (1,649,644) | 51 |
| Data from US Bureau of the Census | ||||
-----
Note 1: The Census Bureau did not produce domestic migration data for 2010 (2009-2010). Any reference to 2010 in this article is based upon an interpolation of the 2010 estimate from 2009 and 2011 Census Bureau estimates.
Note 2: By 2010, housing affordability in all of Florida's four major metropolitan areas with the exception of Miami had been returned to a Median Multiple (median house price divided by median household income) of approximately 3.0 or less, which is the historical norm (See: 7th Annual Demographia International Housing Affordability Survey). During the housing bubble of the early to middle 2000s, the Median Multiple had risen to above 5.0 in all of the major metropolitan areas except Jacksonville.
Wendell Cox is a Visiting Professor, Conservatoire National des Arts et Metiers, Paris and the author of “War on the Dream: How Anti-Sprawl Policy Threatens the Quality of Life”


