
The 2011 census results show that London (the Greater London Authority, which is Inner and Outer London) experienced its greatest percentage population growth in more than 100 years (1891 to 1901). London added nearly 1,000,000 new residents since 2001. That growth, however, is not an indication that "people are moving back to the city." On the contrary, National Statistics data indicates that London lost 740,000 domestic migrants between 2001 and 2011. The continuing core net domestic migration losses have been replicated in other major European metropolitan core areas, such as Milan, Vienna, Stockholm and Helsinki.
Instead as typical in major European core municipalities, the vast majority of the growth in London has come from net international migration. London added 690,000 residents between 2001 and 2010. This pattern has become more prevalent since European Union enlargement, when Eastern Europeans began moving in much larger numbers to the United Kingdom and other richer areas of the old EU-15.
London first became the world's largest urban area in the first quarter of the 19th century, displacing Beijing. At that time, London was approaching 1.4 million residents, living in an urban area of approximately 15 square miles. Today, Inner London, the Outer London suburbs and two rings of exurbs spread 10,500 square miles (27,000 square miles), with a population of 20.3 million. Beijing, meanwhile, has grown so fast that it may once again surpass London in the next decade. However, other metropolitan regions are much larger, such as Tokyo and Jakarta.
Meanwhile, the urban area (the continuous built up area), circumscribed for more than one-half century by the Greenbelt, appears to have a population of 9.5 million, which would place it 27th in population in the world.
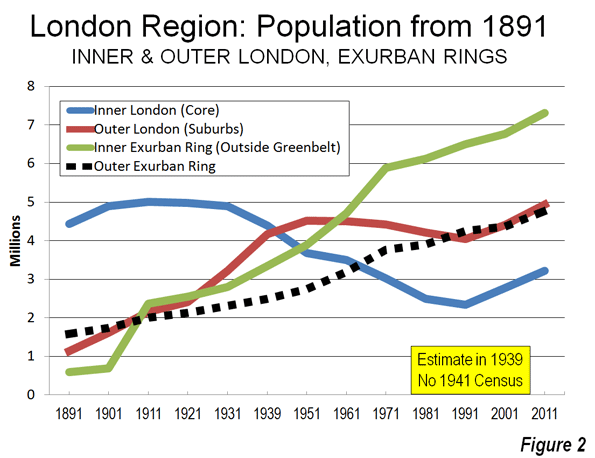
Over the past century, London has experienced substantial ups and downs in its population and still remains below its 1939 population, even with the large gain over the past decade. Over the same period, Inner London lost millions of its residents and only recently has begun to gain some back, largely due to net international migration gains. Outer London gained in the first half of the 20th century, plateaued and then also gained strongly in the last decade. The exurban areas virtually monopolized growth for most of the post-World War II period (Table) until recently.
| London Region: Population 1891-2011 | |||||||
| Year | London Region | London (Greater London Authority) | Inner London (Historical Core) | Outer London (Suburbs) | Exurbs (Outside Greenbelt) | 1st Exurban Ring (Historical Counties Adjacent to Green Belt) | 2nd Exurban Ring |
| 1891 | 7,752,000 | 5,574,000 | 4,432,000 | 1,142,000 | 2,178,000 | 595,000 | 1,583,000 |
| 1901 | 8,931,000 | 6,507,000 | 4,898,000 | 1,609,000 | 2,424,000 | 691,000 | 1,733,000 |
| 1911 | 11,526,000 | 7,162,000 | 5,002,000 | 2,160,000 | 4,366,000 | 2,365,000 | 2,001,000 |
| 1921 | 12,071,000 | 7,386,000 | 4,978,000 | 2,408,000 | 4,684,000 | 2,553,000 | 2,131,000 |
| 1931 | 13,229,000 | 8,111,000 | 4,898,000 | 3,213,000 | 5,119,000 | 2,805,000 | 2,314,000 |
| 1939 | 8,617,000 | 4,441,000 | 4,176,000 | ||||
| 1951 | 14,832,000 | 8,193,000 | 3,680,000 | 4,513,000 | 6,635,000 | 3,891,000 | 2,744,000 |
| 1961 | 15,911,000 | 7,997,094 | 3,492,881 | 4,504,213 | 7,918,000 | 4,720,000 | 3,198,000 |
| 1971 | 17,028,000 | 7,453,000 | 3,031,000 | 4,422,000 | 9,659,000 | 5,894,000 | 3,765,000 |
| 1981 | 16,644,000 | 6,713,000 | 2,498,000 | 4,215,000 | 10,035,000 | 6,127,000 | 3,908,000 |
| 1991 | 17,139,000 | 6,393,000 | 2,343,000 | 4,050,000 | 10,746,000 | 6,497,000 | 4,249,000 |
| 2001 | 18,313,000 | 7,172,000 | 2,766,000 | 4,406,000 | 11,141,000 | 6,773,000 | 4,368,000 |
| 2011 | 20,256,700 | 8,164,000 | 3,222,000 | 4,942,000 | 12,092,700 | 7,318,700 | 4,774,000 |
| Sources | |||||||
| Census except 1939 | |||||||
| Greater London Authority, 1939 | |||||||
The London Region
The London region is composed of the Greater London Authority (GLA), which includes Inner London, the historical core municipality, covering approximately the same geographical area as the old London County Council from the 1890s to the 1960s and Outer London, the great suburban expanse consisting of detached and semi-detached housing.
GLA is surrounded by the Greenbelt, established to contain the expansion of the urban area after World War II, and, at least at first, to decentralize London's unhealthy and overcrowded conditions. Beyond the Greenbelt are the East of England and the Southeast, which are composed of a first exurban ring of historical county areas, adjacent to the Greenbelt, and a second ring of historical county areas in the East and Southeast, beyond the first ring. Virtually all new urban expansion in the London region was forced into the exurbs by the Greenbelt. As a result, all of the London region's growth (6 million) since World War II has been outside the Greenbelt (Figure 1).
Inner London
Inner London has been a population growth miracle over the past two decades. The 2011 population was 3.2 million, up more than 450,000 from 2001 and nearly 900,000 since 1991. However, the 1991 figure of 2.3 million was more than one-half below the 5,000,000 peak reached in 1911. Even though historical core city losses are typical (where geography is held constant), Inner London's loss was huge, at more double those sustained in Chicago (since 1950) and Paris (since 1921). The core of Inner London was developed as a walking city and expanded substantially with the coming of transit. At approximately 26,000 residents per square mile (10,000 per square kilometer), Inner London is less than one-half the density of the ville de Paris and far less dense not only than Manhattan but even less dense than the New York City boroughs of Brooklyn and the Bronx.
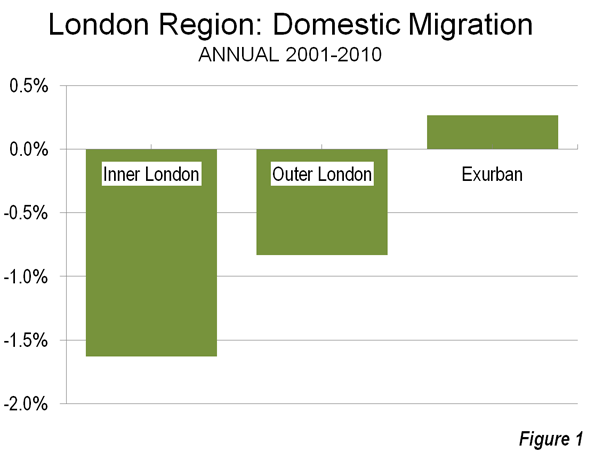
Yet despite the recent increases, inner London's 2011 population is lower than counted in the 1861 census (yes, 1861) Even with the population increase Inner London lost 390,000 domestic migrants (Figure 2) to other parts of Great Britain between 2001 and 2010 (the detailed 2011 data is not yet available at this level).
Tower Hamlets, one of London's 32 boroughs, is an example of this population roller-coaster. Tower Hamlets is located just to the east of the Tower Bridge in Inner London on the north bank of the Thames. It is home to substantial new development spurred by the rapid growth of the financial services industry both in the "square mile" ("city of London) and Canary Wharf. Tower Hamlets grew to 254,000 in 2011, a nearly 80 percent increase from the 142,000 registered in 1981, less than its 1801 population (Note: London Boroughs). But like Inner London, Tower Hamlets used to be much more populous, reaching a record for a London borough at 597,000 residents in 1901. It then lost more than 75 percent of its population over the next 80 years.
Outer London
Outer London, which was combined into the Greater London Council in 1965 (and the Greater London Authority in 2000) also grew strongly, from 4.4 million to 4.9 million and is now at its peak population. Outer London's population density is 10,000 per square mile (4,000 per square kilometer), approximately the same as the District of Columbia. Like Inner London, Outer London also lost domestic migrants, with a net 310,000 residents leaving for other parts of the United Kingdom (Figure 2).
The Greenbelt
Since World War II, the London urban area (principally composed of Inner and Outer London) has been surrounded by the Greenbelt on which development is not permitted. The Greenbelt ranges from 10 to 20 miles wide (25 to 50 kilometers) and covers more than three times the size of the Greater London Authority. The Greenbelt has been cited, along with related policies, with substantially raising house prices and contributing to London's longer commutes than Paris, where there is no greenbelt.
Exurban London
Despite their more modest growth in the last decade, the exurbs have been effective in attracting net domestic migration. From 2001 to 2011, three was a net inflow of domestic migrants of 320,000 (Figure 2). Much of this appears to be people leaving London. During the last year, more than 50,000 residents of London moved to the exurbs. Net international migration to the exurbs had been fairly small earlier in the decade, but increased substantially in the later years. By 2009-2010, two thirds of the London region's net international migration was to the exurbs, and only one-third to London.
First Exurban Ring
The first exurban ring includes the historical counties that border on the outside of the Greenbelt. These areas added approximately 550,000 residents between 2001 and 2011 and reached a new population peak, at 7.3 million.
Second Exurban Ring
The second exurban ring includes the counties of the East of England and the Southeast that are outside the first ring. These areas added more than 400,000 new residents, and reached a new peak population of 4.8 million.
London and England
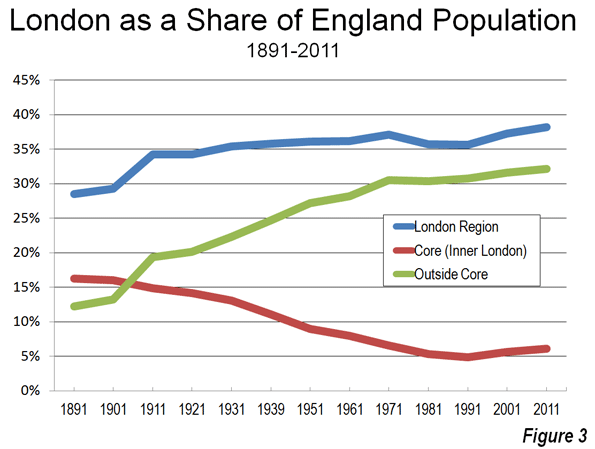
In contrast to the 1991-2001 decade, the 2001-2011 decade indicated a significant slowdown in the share of England's population growth in the London region. In the previous decade, all of England's growth occurred in the greater London region. In the last decade, 50 percent of England's growth took place around the capital. Overall, the core of London (Inner London) population has steadily fallen relative to the rest of England England's while the suburbs and exurbs have grown to include one-third of England's residents (Figure 3). So as Japan is moving to Tokyo, England is still moving to London, but not nearly so fast.
Wendell Cox is a Visiting Professor, Conservatoire National des Arts et Metiers, Paris and the author of “War on the Dream: How Anti-Sprawl Policy Threatens the Quality of Life.”
----
Note: London Boroughs: The 32 boroughs of London were defined after the creation of the Greater London Council in 1965 (which was abolished in 1986). The Greater London Authority provides data to show the historical population figures for the boroughs, going back to the initial census (1801). The new Greater London Authority was established in 2000, with less power than the previous Greater London Council. The 32 boroughs continue to operate, providing local public services.
Photograph: London Suburbs (Outer London) by author


