
The Bureau of Economic Analysis is out with the preliminary numbers for 2013 metro area GDP (see the press release). Here is a spreadsheet with per capita GDP data for all large metros.
We’ve now got enough data that it’s worthwhile to start tracking the trend vs. a 2010 base instead of 2000. With that, here are the top ten large metros by real per capita GDP:
| Rank | Metro Area | 2013 |
| 1 | San Jose-Sunnyvale-Santa Clara, CA | 100,115 |
| 2 | San Francisco-Oakland-Hayward, CA | 78,844 |
| 3 | Seattle-Tacoma-Bellevue, WA | 74,701 |
| 4 | Boston-Cambridge-Newton, MA-NH | 74,643 |
| 5 | Washington-Arlington-Alexandria, DC-VA-MD-WV | 73,461 |
| 6 | Houston-The Woodlands-Sugar Land, TX | 72,258 |
| 7 | New York-Newark-Jersey City, NY-NJ-PA | 69,074 |
| 8 | Portland-Vancouver-Hillsboro, OR-WA | 68,810 |
| 9 | Hartford-West Hartford-East Hartford, CT | 66,870 |
| 10 | Salt Lake City, UT | 62,008 |
San Jose cracks the $100,000 barrier, though that’s in part to the Bay Area being split into two metros, and the base year for constant dollar calculations getting switched from 2005 to 2009. But still impressive.
This list is similar to what we’ve seen before. But how are things changing? Let’s look at the top ten large metros for percent change in their real per capita GDP from 2010 to 2013:
| Rank | Metro Area | 2010 | 2013 | Pct Change |
| 1 | Houston-The Woodlands-Sugar Land, TX | 63,816 | 72,258 | 13.23% |
| 2 | San Jose-Sunnyvale-Santa Clara, CA | 89,806 | 100,115 | 11.48% |
| 3 | Portland-Vancouver-Hillsboro, OR-WA | 63,025 | 68,810 | 9.18% |
| 4 | Columbus, OH | 50,370 | 54,493 | 8.19% |
| 5 | Grand Rapids-Wyoming, MI | 41,248 | 44,482 | 7.84% |
| 6 | Charlotte-Concord-Gastonia, NC-SC | 51,819 | 55,802 | 7.69% |
| 7 | Oklahoma City, OK | 45,993 | 49,441 | 7.50% |
| 8 | Salt Lake City, UT | 57,790 | 62,008 | 7.30% |
| 9 | Nashville-Davidson–Murfreesboro–Franklin, TN | 50,464 | 54,112 | 7.23% |
| 10 | Detroit-Warren-Dearborn, MI | 46,314 | 49,653 | 7.21% |
A full map of this metric is below.
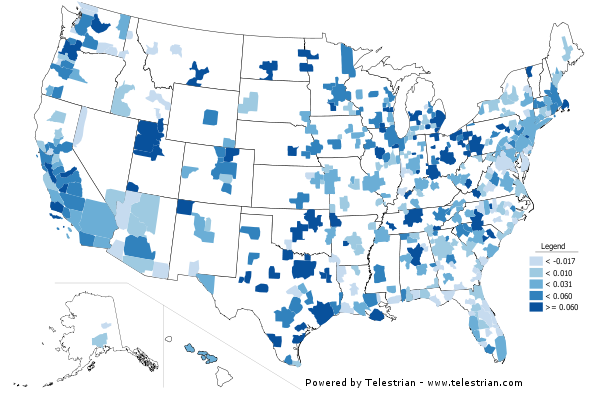
Percent change in real per capita GDP, 2010-2013.
Houston’s #1 showing is very impressive. This is a per capita value remember, so they aren’t on top just by virtue of adding lots of people. And they are in the top ten for 2013 per capita, so it’s not like they started on a low base or something.
Portland and San Jose continues their strong showing in this metric (more on these metros to come next week). Two metros in Michigan made the top ten, though some of that I’d speculate must come from the auto industry recovery, meaning it’s cyclical in nature.
I’ll throw in the total real GDP figures as well, but obviously these heavily align to population. Here are the ten biggest metro GDPs in 2013 (amounts in millions of dollars):
| Row | Geography | 2013 |
| 1 | New York-Newark-Jersey City, NY-NJ-PA | 1,377,989 |
| 2 | Los Angeles-Long Beach-Anaheim, CA | 775,967 |
| 3 | Chicago-Naperville-Elgin, IL-IN-WI | 550,793 |
| 4 | Houston-The Woodlands-Sugar Land, TX | 456,177 |
| 5 | Washington-Arlington-Alexandria, DC-VA-MD-WV | 437,085 |
| 6 | Dallas-Fort Worth-Arlington, TX | 413,627 |
| 7 | Philadelphia-Camden-Wilmington, PA-NJ-DE-MD | 358,091 |
| 8 | San Francisco-Oakland-Hayward, CA | 356,081 |
| 9 | Boston-Cambridge-Newton, MA-NH | 349,652 |
| 10 | Atlanta-Sandy Springs-Roswell, GA | 288,175 |
And the top ten in total real GDP growth percentage, 2010-2013.
| Rank | Metro Area | 2010 | 2013 | Pct Change |
| 1 | Houston-The Woodlands-Sugar Land, TX | 379,595 | 456,177 | 20.17% |
| 2 | San Jose-Sunnyvale-Santa Clara, CA | 165,435 | 192,184 | 16.17% |
| 3 | Austin-Round Rock, TX | 86,546 | 98,126 | 13.38% |
| 4 | Portland-Vancouver-Hillsboro, OR-WA | 140,717 | 159,266 | 13.18% |
| 5 | Charlotte-Concord-Gastonia, NC-SC | 115,229 | 130,318 | 13.09% |
| 6 | Oklahoma City, OK | 57,856 | 65,246 | 12.77% |
| 7 | Nashville-Davidson–Murfreesboro–Franklin, TN | 84,572 | 95,124 | 12.48% |
| 8 | Dallas-Fort Worth-Arlington, TX | 368,015 | 413,627 | 12.39% |
| 9 | Salt Lake City, UT | 63,090 | 70,719 | 12.09% |
| 10 | San Antonio-New Braunfels, TX | 80,101 | 89,463 | 11.69% |
Richard Florida posted some thoughts on this data over at City Lab. I’m less bothered than he is by Washington, DC’s poor performance, however. Much like Detroit’s cyclical upswing, I think short term turbulence in DC from the sequester and fiscal challenges was to be expected.
Aaron M. Renn is an independent writer on urban affairs and the founder of Telestrian, a data analysis and mapping tool. He writes at The Urbanophile.


