
Growth in the current land areas of the 52 major metropolitan areas (over 1 million) provides an effective overview of changes in how the population has been redistributed United States since 1900. These metropolitan areas are composed of nearly 440 counties, as defined by the Office of Management and Budget for 2013. There have been such substantial changes in metropolitan area concepts and definitions that reliable comparisons extending beyond a decade from Census Bureau are impossible. (See Caution: Note 1).
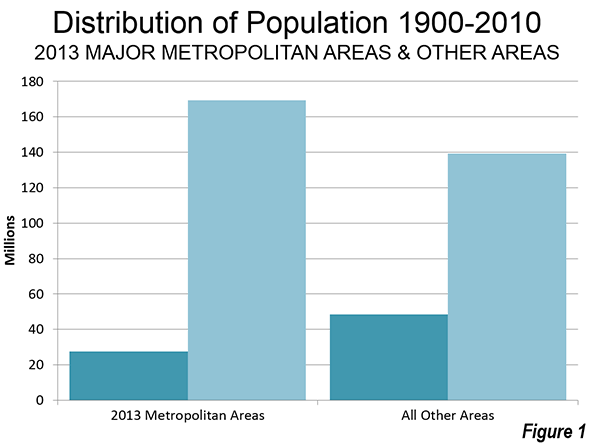
In 1900, the land areas which hold today’s major metropolitan areas had a population of 27.6 million. This was only 36 percent of the national population, which stood at 76.2 million. By 2010, these 52 areas had reached 169.5 million population, approximately 55 percent of the nation's 308.7 million population (Figure 1). Over the period of 1900 to 2010, the 52 areas captured 61 percent of the nation's growth, while the balance of the nation accounted for the other 39 percent.
From 1900
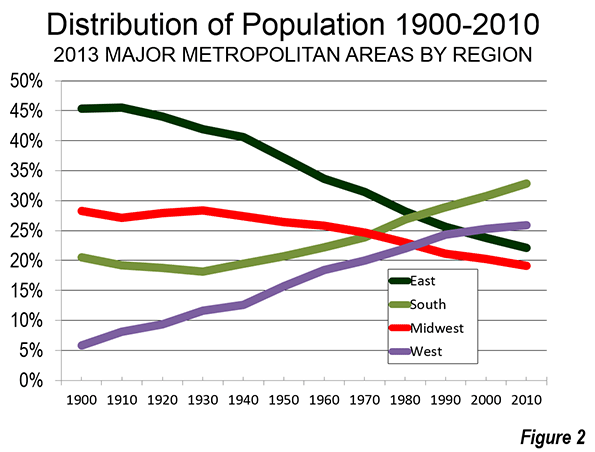
The growth was anything but equal among the nation's four Census Bureau regions (metropolitan areas were allocated using the Census Bureau region of the historical core municipality). In 1900, the East was dominant, with 45 percent of the population of the 52 areas. The Midwest was a strong second with 28 percent, while the South had 21 percent of the population. The West accounted for only six percent of the population of the 52 areas.
By comparison, growth since 1900 has been in the parts of the country least populated in 1900. The South alone obtained 35 percent of the population increase, followed by the West with 30 percent of the increase. The East gained only 18 percent of the increase, while the Midwest gained only 17 percent.
From 1950
Things had already begun to change significantly by 1950, when the East's share had fallen to 37 percent. The Midwest experienced a slight and dropped to 26 percent, while the South remained at 21 percent. The biggest change was in the West, which nearly tripled its percentage of the population, to 16 percent.
The changes were much more significant to 2010. The formerly dominant East has now been displaced by the South, with 33 percent of the population. The West also passed the East, with 26 percent of the population. The East's share had fallen to 22 percent, while the Midwest had fallen substantially, to 19 percent (Figure 2).
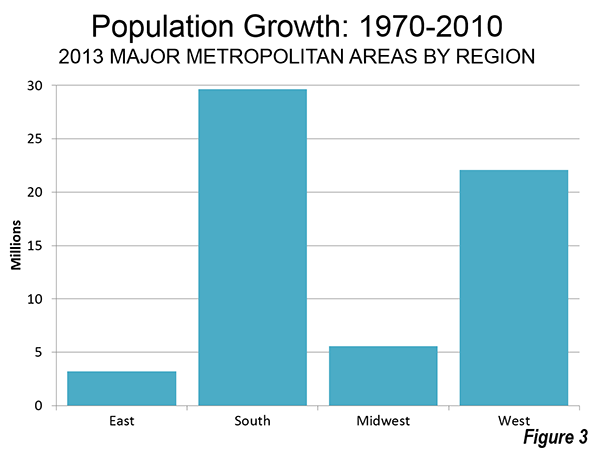
Between 1950 and 1970 the highest growth was in the South, which added 11 million residents and the lowest growth was in the East, which added 7 million residents. However, after 1970 there was a sea– change in regional population growth. Since that time, the East and Midwest have fallen strongly behind. From 1970 to 2010, the East added only 3.2 million residents, less than one half the 7.3 million residents added between 1950 and 1970. The Midwest did modestly better, adding 5.6 million residents between 1970 and 2010, but well below the 7.7 million residents added between 1950 and 1970.
The big gains were made in the South and West. Between 1950 and 1970, the West added nearly as many new residents (10.4 million) as the South (11.0 million), despite starting from a smaller base. However, since 1970, the momentum has shifted to the South which added nearly 30 million new residents from 1970 to 2010. The West also grew strongly, but fell behind the South in growth, with an increase of 22 million. The South accounted for 49 percent of the growth over the period. The substantial deceleration of population growth in California's coastal metropolitan areas (Los Angeles, San Francisco, San Diego and San Jose) was a major factor in slowing the West's growth rate (Figure 3).
Metropolitan Highlights
A review of the individual metropolitan areas indicates the pervasiveness of growth in the South and West and the more lackluster growth of the East and Midwest. The five fastest growing current metropolitan areas from 1900, 1950, and 1980 to 2010 were all in the South and West. The five slowest growing were all in the East and Midwest (Table).
| 2010 Metropolitan Area Population Compared to 1900 | ||
| 2013 Geographical Definitions | ||
| TOP 10 | ||
| FROM 1900 TO 2010 | Times 1900 | |
| 1 | Miami | 1113 |
| 2 | Phoenix | 150 |
| 3 | Orlando | 97 |
| 4 | Riverside-San Bernardino | 92 |
| 5 | San Diego | 88 |
| FROM 1950 TO 2010 | Times 1950 | |
| 1 | Las Vegas | 40.7 |
| 2 | Orlando | 11.2 |
| 3 | Phoenix | 11.2 |
| 4 | Riverside-San Bernardino | 9.4 |
| 5 | Miami | 8.0 |
| FROM 1980 TO 2010 | Times 1980 | |
| 1 | Las Vegas | 4.21 |
| 2 | Austin | 2.93 |
| 3 | Raleigh | 2.81 |
| 4 | Riverside-San Bernardino | 2.71 |
| 5 | Orlando | 2.71 |
| TOP 10 | ||
| FROM 1900 TO 2010 | Times 1900 | |
| 1 | Pittsburgh | 1 |
| 2 | Buffalo | 1 |
| 3 | Providence | 1 |
| 4 | Boston | 1 |
| 5 | Rochester | 1 |
| FROM 1950 TO 2010 | Times 1950 | |
| 1 | Pittsburgh | 0.91 |
| 2 | Buffalo | 1.04 |
| 3 | Cleveland | 1.24 |
| 4 | Detroit | 1.36 |
| 5 | Providence | 1.36 |
| FROM 1980 TO 2010 | Times 1980 | |
| 1 | Pittsburgh | 0.89 |
| 2 | New Orleans | 0.91 |
| 3 | Buffalo | 0.91 |
| 4 | Cleveland | 0.96 |
| 5 | Detroit | 0.99 |
No city can compare to the growth registered by Miami since 1900. At that time, the three counties of the 2013 metropolitan area had only 5,000 residents. By 2010, Miami had reached 5.6 million and was more than 1,100 times its size in 1900. Next was fast growing Phoenix, which at 150 times its 1900 size (28,000), grew at only a fraction of Miami's growth. Orlando is 97 times its 1900 size, Riverside-San Bernardino is 92 times, and San Diego is 88 times its 1900 population.
The slowest growing were all in the East, although each grew over the past century. Pittsburgh grew the slowest and was 1.81 times its 1900 size in 2010. Buffalo, Providence, Boston and Rochester rounded out the slowest growing five from 1900.
From 1950, Las Vegas was the fastest growing, with a 2010 population 40.7 times that of 60 years before (complete data is not available for Las Vegas in 1900). Orlando, Phoenix, Riverside-San Bernardino, and Miami were also in the top five.
The bottom five from 1950 was led by Pittsburgh, which lost population to 2010. The other four, Buffalo, Cleveland, Detroit, and Providence all gained, but only modestly.
Las Vegas was also the fastest growing since 1980, with a 2010 population was 4.21 times its 1980 level. The other top five cities were Austin, Raleigh, Riverside-San Bernardino, and Orlando.
The bottom five between 1980 and 2010 followed the pattern since 1950, with the exception of New Orleans, which ranked second slowest growing. This reflects largely the impact of Hurricane Katrina. Other than New Orleans, the four slowest growing were Pittsburgh, Buffalo, Cleveland, and Detroit. All five of these cities lost population from 1980.
The data for all 52 metropolitan areas for each census year (and 2013) is on this webpage.
The United States: Moving South and Increasingly
The population shifts in the United States have been substantial over the past 110 years. In 1900, nearly three quarters of the population of these cities was located in the East and Midwest. By 2010, the balance had shifted substantially, with 59 percent of the population in the major metropolitan areas of the South and West. However, in the West, coastal California growth rates are beginning to look more like those of the East and Midwest. Current projections suggest that this shift will continue, though nothing about the future is a certainty.
Wendell Cox is principal of Demographia, an international public policy and demographics firm. He is co-author of the "Demographia International Housing Affordability Survey" and author of "Demographia World Urban Areas" and "War on the Dream: How Anti-Sprawl Policy Threatens the Quality of Life." He was appointed to three terms on the Los Angeles County Transportation Commission, where he served with the leading city and county leadership as the only non-elected member. He was appointed to the Amtrak Reform Council to fill the unexpired term of Governor Christine Todd Whitman and has served as a visiting professor at the Conservatoire National des Arts et Metiers, a national university in Paris.
----
Note 1: Caution: This article compares 2013 geographical boundaries of metropolitan areas to census years between 1900 and 2010. In years before 2010, metropolitan area geographical definitions were different from 2010 and before 2000 metropolitan area conceptual definitions were different. As a result, this article does not compare 2013 metropolitan areas with metropolitan areas as defined in any year before 2013.
Note 2: The population data referred to is for the current county composition of metropolitan areas. These data are not adjusted for county boundary changes that may have occurred. For example, no data is available for Las Vegas in 1900, because its one metropolitan county, Clark, did not exist until the 1910 census.
Top photo: Miami's Elser's Pier in the 1920s.


