
The United States has 53 mid-sized metropolitan areas, with populations from 500,000 to 1 million. These metropolitan areas together had a population of nearly 38 million in 2014, according to the most recent Census Bureau population estimates (Table). In number, they match the 53 major metropolitan areas (over 1 million population), though they have only one fifth of the population (178 million). The mid-sized metropolitan areas are growing somewhat slower than the major metropolitan areas, at an annual rate of 0.81% between 2010 and 2014, compared to 1.00% in the major metropolitan areas. Combined, the major metropolitan areas and the mid-sized metropolitan areas have two-thirds of the US population.
Largest Mid-Sized Metropolitan Areas
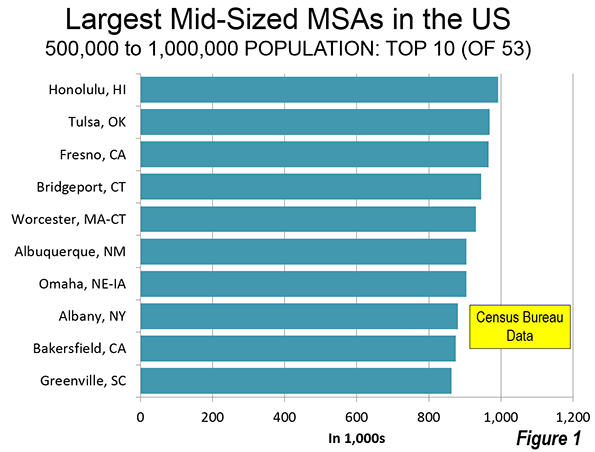
Honolulu is the largest, with a population of 991,000. Honolulu seems destined to graduate into the major metropolitan category, though its growth rate over the last year could indicate this will occur in 2016 or later, rather than 2015 which appeared to be likely from earlier data. Tulsa, Oklahoma's second largest metropolitan area, is growing somewhat more slowly, but seems likely to pass the million mark by the 2020 census. Third-ranked Fresno is growing somewhat faster and should also reach 1 million population by 2020. Bridgeport, which is a part of the New York Combined Statistical Area (Note) has grown almost as fast as the other three since 2010, though like Honolulu, its growth rate in the past year has been halved. Bridgeport has an outside chance of reaching 1 million by the 2020 census.
The next three fastest-growing metropolitan areas, (Worcester, Albuquerque, and Omaha) all have populations exceeding 900,000. Worcester is experiencing the slow growth that would be expected for the Northeastern metropolitan area and is unlikely to reach 1 million this decade. Surprisingly, Albuquerque is growing almost as slowly and its 2014 growth was well below its previous three-year rate. Albuquerque has typically been a fast-growing metropolitan area. Omaha, which ranks seventh is the fastest growing of this group, sustaining a growth rate of about 1.0%, which is above the national average. Omaha should reach 1 million before 2030.
The ninth and 10th largest mid-sized metropolitan areas are growing more strongly than average. This includes Bakersfield and Greenville (SC), both of which should reach 1 million before 2030 (Figure 1). Greenville is the only other metropolitan area in the top 10 growing at a rate above 1.0 percent (1.08 percent). By contrast five of the top 10 major metropolitan areas are growing at above 1.0 percent (Dallas-Fort Worth, Houston, Washington, Miami, and Atlanta).
Among the top 10, all but Albany, Albuquerque and Omaha are single county metropolitan areas. Metropolitan areas are made up of complete counties, only three are single counties (San Diego, Las Vegas, and Tucson). Among the mid-sized metropolitan areas, their smaller size means that many more are composed of single counties.
Smallest Mid-Sized Metropolitan Areas
There were two new entries to the list of mid-sized metropolitan areas in 2014. One was Fayetteville (AR-MO), home of both the Wal-Mart world headquarters (Bentonville, AR) and the University of Arkansas. Santa Rosa, which is an exurban metropolitan area in the San Francisco Combined Statistical Area was also added.
Fastest Growing Mid-Sized Metropolitan Areas
The 10 fastest growing mid-sized metropolitan areas are from every major region of the country except for the Northeast. Cape Coral, FL was the fastest growing between 2010 and 2014. Its growth rate picked up substantially in 2013 to 2014. Cape Coral (formerly called Fort Myers) was hit particularly hard by the real estate bust of the late 2000s. The core municipality itself has not only the usual street system, but an extensive canal system (photo above). It is hard to imagine a metropolitan area that feels less urban.
Charleston, SC was second ranked, nearly equaling the growth rate of Cape Coral. Four other Southern metropolitan areas were among the fastest growing, including Fayetteville, AR-MO (4th), academic and research center Durham, NC (6th), which is a part of the Raleigh Combined Statistical Area. The other Southern entries were Rio Grande Valley and border metropolitan area McAllen, TX and Sarasota (North Port), FL. Current growth rates indicate that Charleston and McAllen should exceed 1,000,000 by 2030, while chances for Sarasota and Cape Coral are somewhat less (Figure 2).
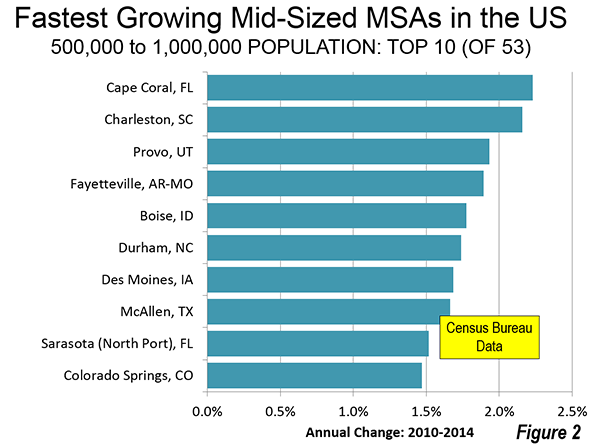
Three of the fastest growing mid-sized metropolitan areas were in the West, including Provo, UT, Boise, ID and Colorado Springs. Des Moines, was the only Midwestern metropolitan area among the fastest growing.
Slowest Growing Mid-Sized Metropolitan Areas
Virtually all of the slowest growing mid-sized metropolitan areas are former industrial behemoths that lost out in the competition for survival in the Northeast and Midwest. A visit to any of these cities will reveal either a relatively strong pre-World War II central business district or the remains of one. Each of these has a built form that looks more like Louisville or Cincinnati than the dominant pattern for new metropolitan areas that developed with a far more modest density gradient and with much weaker cores.
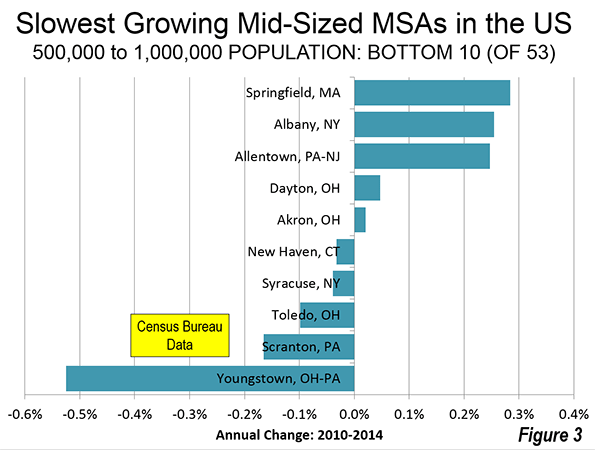
Five of the slowest growing are actually losing population. Since 2010, Youngstown has lost an average of 0.5% of its population annually. Scranton (Wilkes-Barre), PA continues its eight decade decline. The list also includes Toledo; Syracuse; Akron; Dayton; and Springfield, MA; which once had been strong manufacturing centers. The list also includes New Haven, which also lost population despite being home to Yale University. Allentown is also an old manufacturing center, but has recently been added to the New York Combined Statistical Area, indicating the expansion of the nation's largest labor market. Perhaps the most unusual of the bottom 10 in growth is Albany, NY, which is one of the largest state government centers in the United States. Certainly, the Albany area has lost much of its industrial base, but a large government presence often can compensate for such losses.
Prospects
The list of mid-sized metropolitan areas is fluid. As noted above, a number of mid-sized metropolitan areas could move into the major metropolitan category before 2020 or 2030. On the other hand, there will be new mid-sized metropolitan areas. Three seem likely to be added by the 2020 census (Lexington, KY, Lafayette, LA and Pensacola, FL). There should be a rush of new mid-sized metropolitan areas between 2020 and 2030, at current growth rates. This could include Visalia, CA; Springfield, MO; Corpus Christi, TX; Port St. Lucci, FL; Reno, NV; Asheville, NC; Huntsville, AL; Santa Barbara, CA; and Myrtle Beach, SC.
Note: Combined Statistical Areas are larger labor markets that are combinations of metropolitan areas. The commuting exchange between these metropolitan areas is less than that required to be included in a metropolitan area. Perhaps the most notable examples of combined statistical areas are New York, Los Angeles and San Francisco. The New York CSA which extends from the metropolitan area to include New Haven and Bridgeport in Connecticut and Allentown in Pennsylvania and New Jersey. The Los Angeles CSA includes the Riverside-San Bernardino and Oxnard metropolitan areas. The San Francisco CSA includes the San Francisco metropolitan area, the San Jose metropolitan area and the smaller metropolitan areas of Santa Rosa, Santa Cruz, Vallejo and Stockton (added since 2010).
| Mid-Sized Metropolitan Areas (US) | |||||||
| Population: 500,000 to 1,000,000: 2010-2014 | |||||||
| Population | 2013-2014 | ||||||
| Rank | Metropolitan Area | 2010 | 2013 | 2014 | Annual % Change: 2010-2014 | Rank | % Change: 2010-2014 |
| 1 | Honolulu, HI | 953 | 987 | 992 | 0.94% | 21 | 0.48% |
| 2 | Tulsa, OK | 937 | 962 | 969 | 0.79% | 25 | 0.71% |
| 3 | Fresno, CA | 930 | 956 | 966 | 0.89% | 22 | 1.03% |
| 4 | Bridgeport, CT | 917 | 942 | 945 | 0.73% | 29 | 0.35% |
| 5 | Worcester, MA-CT | 917 | 928 | 930 | 0.34% | 43 | 0.26% |
| 6 | Albuquerque, NM | 887 | 903 | 905 | 0.46% | 39 | 0.14% |
| 7 | Omaha, NE-IA | 865 | 896 | 904 | 1.04% | 15 | 0.99% |
| 8 | Albany, NY | 871 | 878 | 880 | 0.25% | 45 | 0.19% |
| 9 | Bakersfield, CA | 840 | 866 | 875 | 0.96% | 19 | 1.00% |
| 10 | Greenville, SC | 824 | 850 | 862 | 1.08% | 14 | 1.42% |
| 11 | New Haven, CT | 862 | 863 | 861 | -0.03% | 49 | -0.20% |
| 12 | Knoxville, TN | 838 | 852 | 858 | 0.56% | 36 | 0.66% |
| 13 | Oxnard, CA | 823 | 841 | 846 | 0.65% | 32 | 0.62% |
| 14 | El Paso, TX | 804 | 835 | 837 | 0.94% | 20 | 0.25% |
| 15 | McAllen, TX | 775 | 819 | 831 | 1.66% | 8 | 1.48% |
| 16 | Allentown, PA-NJ | 821 | 827 | 830 | 0.25% | 46 | 0.34% |
| 17 | Baton Rouge, LA | 802 | 820 | 825 | 0.67% | 31 | 0.62% |
| 18 | Dayton, OH | 799 | 802 | 801 | 0.05% | 47 | -0.10% |
| 19 | Columbia, SC | 768 | 792 | 800 | 0.99% | 17 | 1.02% |
| 20 | Sarasota (North Port), FL | 702 | 733 | 749 | 1.52% | 9 | 2.19% |
| 21 | Greensboro, NC | 724 | 741 | 747 | 0.73% | 28 | 0.71% |
| 22 | Little Rock, AR | 700 | 724 | 729 | 0.97% | 18 | 0.66% |
| 23 | Charleston, SC | 665 | 712 | 728 | 2.16% | 2 | 2.19% |
| 24 | Stockton, CA | 685 | 705 | 716 | 1.02% | 16 | 1.50% |
| 25 | Akron, OH | 703 | 703 | 704 | 0.02% | 48 | 0.09% |
| 26 | Colorado Springs, CO | 646 | 679 | 687 | 1.47% | 10 | 1.21% |
| 27 | Cape Coral, FL | 619 | 661 | 680 | 2.23% | 1 | 2.75% |
| 28 | Boise, ID | 617 | 650 | 664 | 1.77% | 5 | 2.15% |
| 29 | Syracuse, NY | 663 | 663 | 661 | -0.04% | 50 | -0.21% |
| 30 | Winston-Salem, NC | 641 | 652 | 655 | 0.53% | 37 | 0.54% |
| 31 | Wichita, KS | 631 | 638 | 641 | 0.38% | 42 | 0.44% |
| 32 | Lakeland, FL | 602 | 623 | 635 | 1.25% | 12 | 1.84% |
| 33 | Madison, WI | 605 | 627 | 634 | 1.08% | 13 | 1.01% |
| 34 | Ogden, UT | 597 | 622 | 632 | 1.35% | 11 | 1.62% |
| 35 | Springfield, MA | 622 | 628 | 629 | 0.28% | 44 | 0.11% |
| 36 | Des Moines, IA | 570 | 600 | 612 | 1.68% | 7 | 1.91% |
| 37 | Daytona Beach (Deltona), FL | 590 | 601 | 610 | 0.77% | 26 | 1.46% |
| 38 | Toledo, OH | 610 | 608 | 607 | -0.10% | 51 | -0.16% |
| 39 | Augusta, GA-SC | 565 | 580 | 584 | 0.77% | 27 | 0.59% |
| 40 | Jackson, MS | 567 | 577 | 578 | 0.43% | 40 | 0.06% |
| 41 | Provo, UT | 527 | 562 | 571 | 1.93% | 3 | 1.64% |
| 42 | Harrisburg, PA | 549 | 558 | 561 | 0.48% | 38 | 0.53% |
| 43 | Scranton, PA | 564 | 562 | 560 | -0.17% | 52 | -0.38% |
| 44 | Melbourne (Palm Bay), FL | 543 | 551 | 557 | 0.58% | 35 | 0.99% |
| 45 | Youngstown, OH-PA | 566 | 556 | 553 | -0.52% | 53 | -0.52% |
| 46 | Chattanooga, TN-GA | 528 | 542 | 545 | 0.72% | 30 | 0.44% |
| 47 | Durham, NC | 504 | 534 | 543 | 1.74% | 6 | 1.70% |
| 48 | Spokane, WA | 528 | 536 | 541 | 0.58% | 34 | 0.98% |
| 49 | Lancaster, PA | 519 | 530 | 533 | 0.62% | 33 | 0.60% |
| 50 | Modesto, CA | 514 | 526 | 532 | 0.79% | 23 | 1.09% |
| 51 | Portland, ME | 514 | 520 | 524 | 0.43% | 41 | 0.61% |
| 52 | Fayetteville, AR-MO | 463 | 492 | 502 | 1.89% | 4 | 1.88% |
| 53 | Santa Rosa, CA | 484 | 495 | 500 | 0.79% | 24 | 0.98% |
| Total | 36,361 | 37,316 | 37,620 | 0.81% | |||
| In 000s | |||||||
| Data from Census Bureau | |||||||
| More familiar names substituted in some cases (Census names in parentheses) | |||||||
Photo: Cape Coral, Florida (fastest growing mid-sized metropolitan area)
Wendell Cox is principal of Demographia, an international public policy and demographics firm. He is co-author of the "Demographia International Housing Affordability Survey" and author of "Demographia World Urban Areas" and "War on the Dream: How Anti-Sprawl Policy Threatens the Quality of Life." He was appointed to three terms on the Los Angeles County Transportation Commission, where he served with the leading city and county leadership as the only non-elected member. He served as a visiting professor at the Conservatoire National des Arts et Metiers, a national university in Paris. He is a Senior Fellow at the Center for Opportunity Urbanism and a member of the Board of Advisors at the Center for Demographics and Policy at Chapman University.


