
Every now and then, something happens to cause California’s comfortable establishment to celebrate the state’s economy. Recent budget surpluses and jobs data have provided several opportunities, never mind that these are hardly summary statistics. They don’t tell the complete story.
The celebrants conveniently ignore California’s nation-leading poverty, huge inequality, persistent negative domestic migration, and the fact that with about 12 percent of the nation’s population, California is home to about 30 percent of the nation’s welfare recipients.
A recent Next 10 report, prepared by Beacon Economics, has provided another opportunity for celebration. The Los Angeles Times’ coverage of the report is here. Their reporter, Chris Kirkham, provides a straight-forward summary, including charts not in the original report and quotes from people who might not be expected to be mindless cheerleaders. Full disclosure: He tried to interview me, but I was unavailable.
My favorite coverage was a celebratory piece at The National Memo, by one Froma Harrop, titled High Taxes, Regulations, and a Swell Economy. Try telling the children of one of the several families living in a single-family home, children with little prospect of ever living a middle-class lifestyle, that California’s economy is swell. Try telling that to the huge numbers of long-term unemployed in California’s Central Valley, or one of the many people who, like Martin Saldana, have been poorly served by California’s swell economy. California’s economy might be swell, but only for a portion of the population.
Harrop, and apparently large numbers of California’s comfortable establishment, don’t appear to care much about their less-fortunate fellow citizens. She’s channeling Marie Antoinette when she says “OK. Those who can’t pay the price—or who want bigger spaces—can and often do consider other parts of the country.”
Right. What about all the people who provide services to California’s wealthy coastal residents in places like Monterey and Santa Barbara? What about counties like Napa and Ventura that insist, by law, that land be set aside for agriculture, an industry that employs thousands, but can’t survive and pay wages that would allow a respectable standard of living in these high-cost counties?
This time the celebration turns out to be about nothing. The Next 10 report is seriously flawed. The first hint of weakness is on the first page of the actual report, page 4 of the document, where they say “This analysis is trying to show….” Serious analysis attempts to answer questions, not support a pre-conceived opinion.
The next clue is Table 1. In a report filled with time series, the authors present data on one point in time, say that California has the fourth highest net job growth rate, and conclude all is good. Why would they do that? Could it be that the time series doesn’t support the narrative?
Actually, they used the only recent year where California performed significantly better than the United States. Here’s the data in time series. It’s similar to a chart in the Los Angeles Times’ piece. We compare California’s net job creation rate with that of the United States:
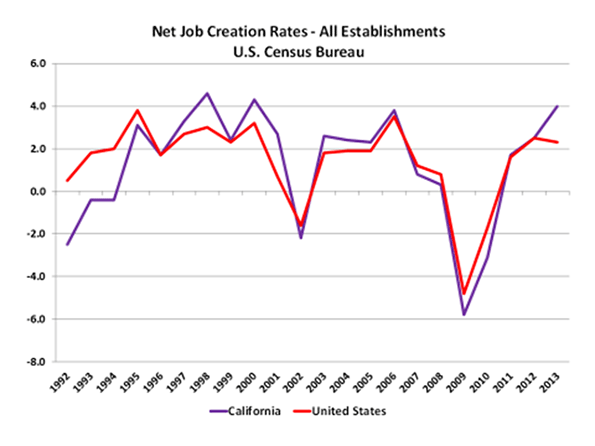
Doesn’t look so spectacular, does it?
Maybe the rankings would look better? Below is a chart of California’s ranking going back to 1977. Remember, one is good, 50 is bad:
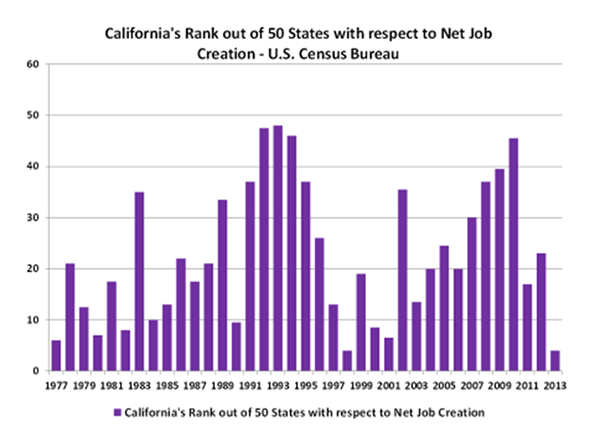
The narrative isn’t supported here either. California has only ranked in the top 20 twice since 2006, and over that time it’s been in the bottom 20 three times. Indeed, California has been in the top ten only once since 2001. That was the data point they used in their analysis.
The report has other weaknesses.
Consider the charts 4a through 4f. Combined, they purport to show that for California, firms of all ages were net job creators every year. There is no year where they show firms of any age group having net job losses. Given the well-documented massive California job losses in the past few recessions, this is simply unbelievable.
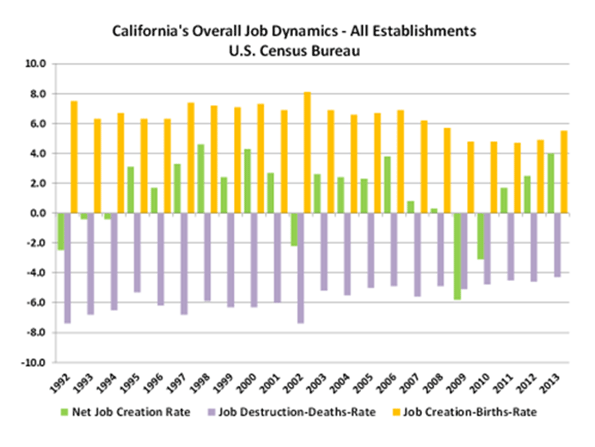
Indeed, a close look at the charts yields apparent internal inconsistencies. Chart 4e is an example. In 2002, 2009, and 2010 job destruction rates were far greater than job creation rates, but somehow they report that net job creation rates managed to remain positive in each of these years? For the record, we built a chart using aggregate data that show net job loss rates for all California establishments of -2.2, -5.8, and -3.1 for the years 2002, 2009 and 2010, respectively:
California’s apologists don’t do themselves any favors by resorting to such shoddy and misleading work. California has had some good job years recently. It also has some huge strengths. These include a world-leading venture capital infrastructure, a world-leading climate, and a fantastic location between Asia and the massive American consumer market.
California has some huge challenges too, including the poverty, inequality, and limited opportunity for minorities. Ignoring these challenges and exaggerating the state’s strengths is a guarantee that California will never be the land of opportunity that it was --- or could be.
Bill Watkins is a professor at California Lutheran University and runs the Center for Economic Research and Forecasting, which can be found at clucerf.org.


