
The new 2017 US Census Bureau metropolitan area population estimates have been published. They show a significant increase in domestic migration away from the largest cities (the major metropolitan areas, with more than 1,000,000 population) toward the metropolitan areas with from 500,000 to 1,000,000 population. The data also shows an acceleration of suburban versus core county population growth within the major metropolitan areas themselves. The data is summarized in the table at the bottom of the article.
Stronger Net Domestic Migration in Metropolitan Areas under 1,000,000 Population
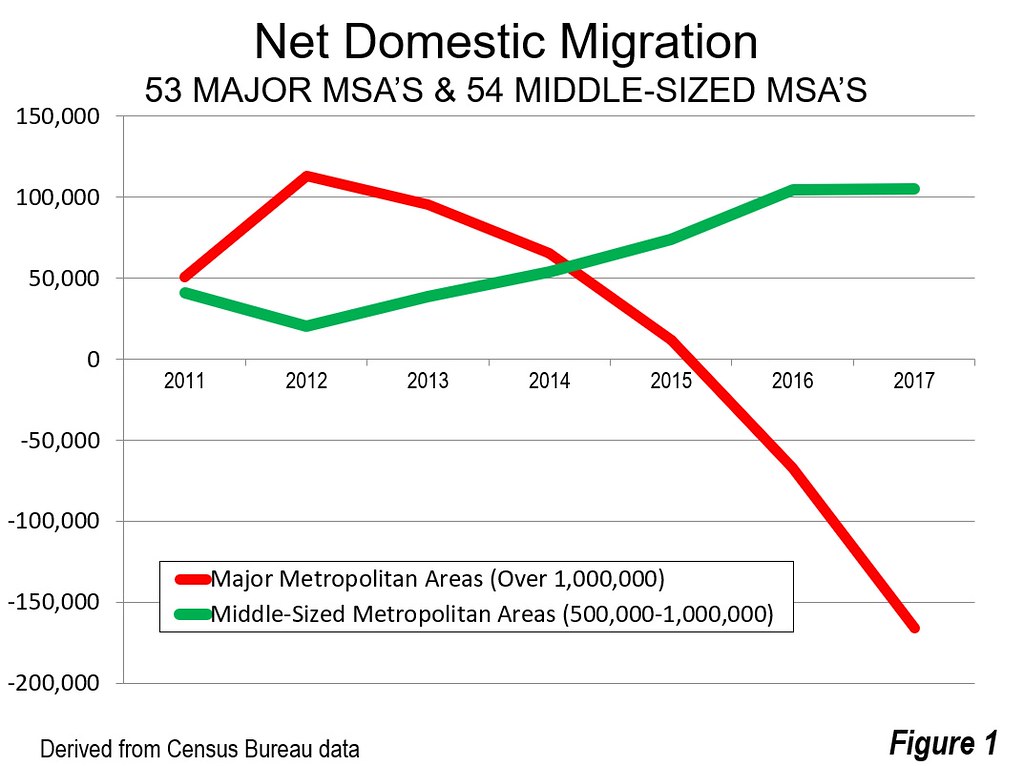
Earlier in the decade, the 53 major metropolitan areas (over 1,000,000 population) had greater net domestic migration than in the 54 middle-sized metropolitan areas (between 500,000 and 1,000,000 population). In fact, since 2012, net domestic migration in the major metropolitan areas have dropped every year. By 2016, the major metropolitan areas had a net domestic migration loss of 67,000, which accelerated to 166,000 in 2017. In contrast, the middle-sized metropolitan areas have experienced annual increases in net domestic migration each year since 2012. In 2017, the metropolitan areas with between 500,000 and 1,000,000 population gained 271,000 more net domestic migrants than the metropolitan areas with more than 1,000,000 population (Figure 1, see Note).
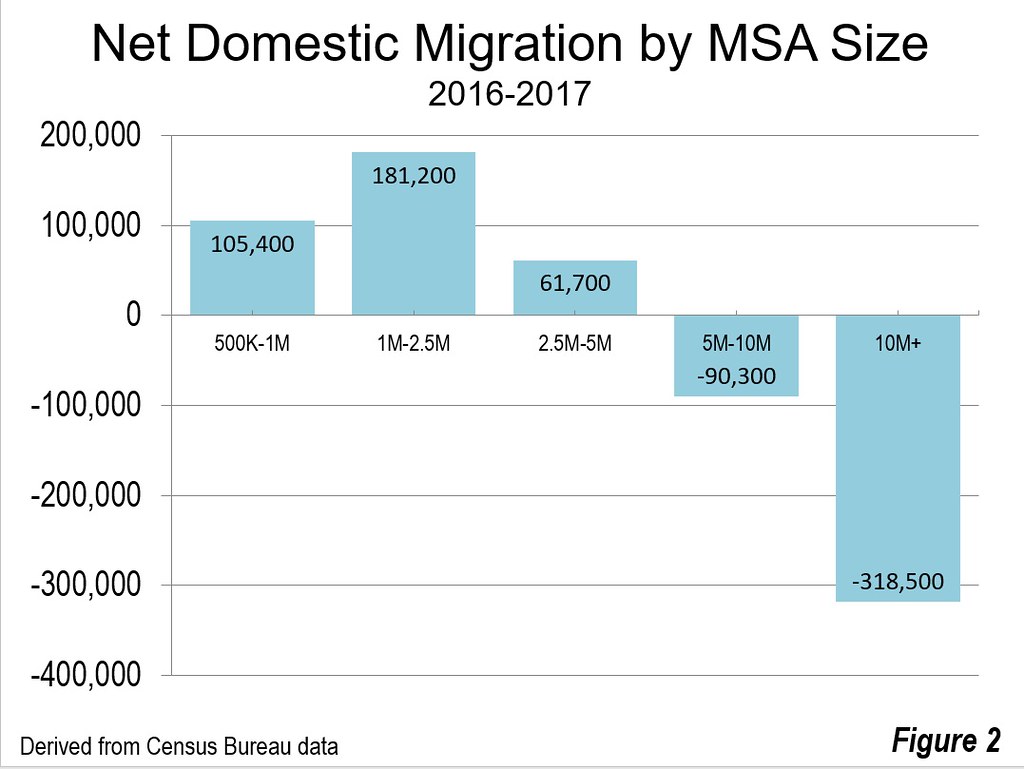
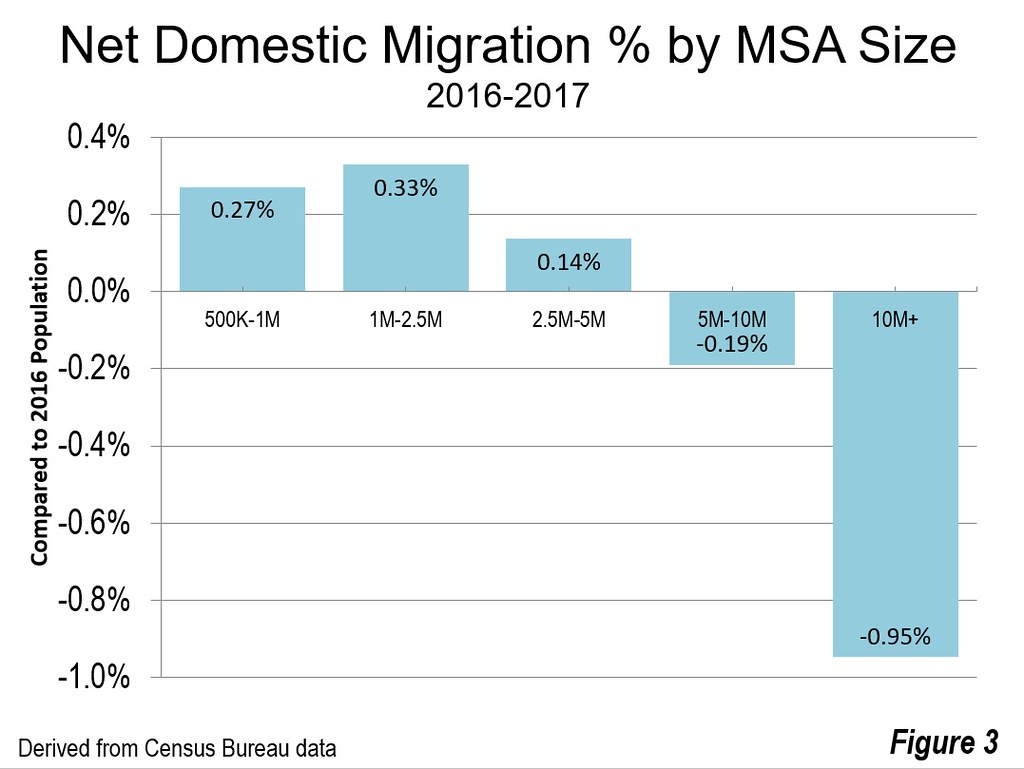
A more detailed analysis shows that metropolitan areas between 1.0 and 2.5 million population gained the most domestic migrants relative to their 2016 population (0.33 percent). The under 1,000,000 category (the “larger” metropolitan areas) have the second greatest net domestic migration (0.27%), while the 2,500,000 to 5,000,000 category shows a smaller increase (0.14 percent). Metropolitan areas between 5,000,000 and 10,000,000 had a small loss (minus 0.19 percent), while New York and Los Angeles, the two megacities (over 10,000,000), had an enormous 0.95 percent net domestic migration loss, at 209,000. (Figures 2 and 3).
Domestic Migration to Suburbs Accelerates
Domestic migration also continues to accelerate to the suburbs of the major metropolitan areas. The core counties of the 50 major metropolitan areas (over 1,000,000) with more than one county have continued to shed domestic migrants (Note). Between 2016 and 2017, nearly 438,000 net residents moved from the core counties (which include the urban cores) to elsewhere in the nation. The suburban counties of the same metropolitan areas gained 252,000. Thus, the domestic migration gain in the suburbs was 690,000 more than in the core counties. (Figure 4).
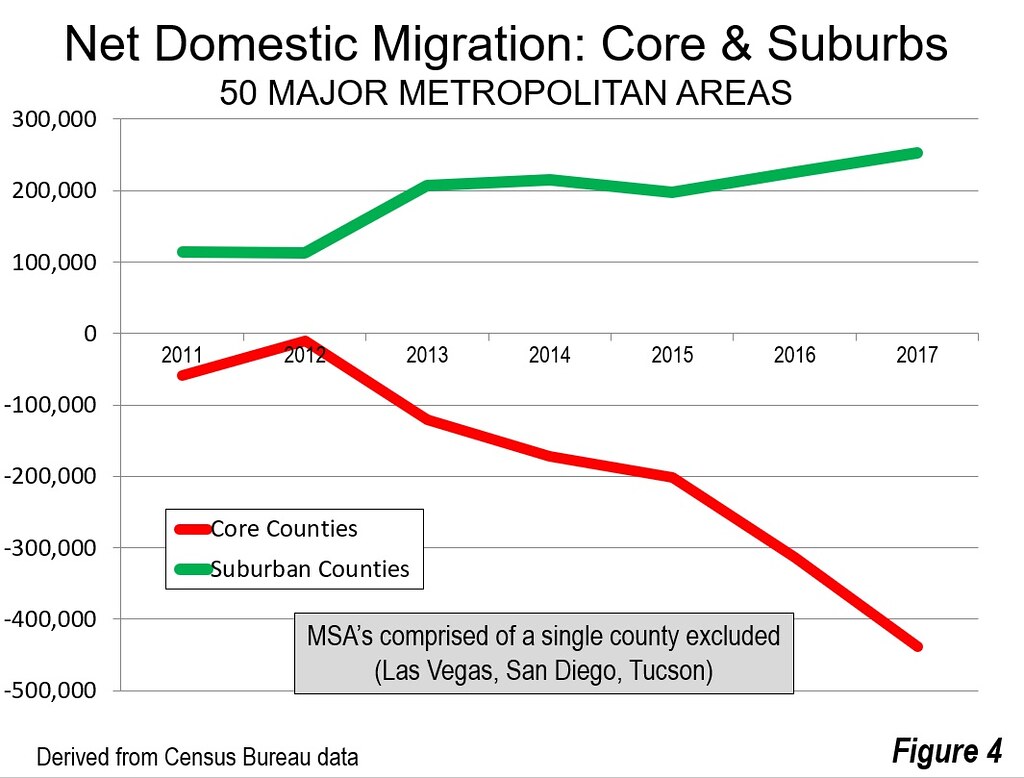
Since 2010, the core counties have lost 1.39 million net domestic migrants to other parts of the nation, while the suburban counties have gained 1.38 million, This indicates a net movement of nearly 2.8 million residents to the suburbs compared to the core counties during the 2010s.
National Summary of Net Domestic Migration
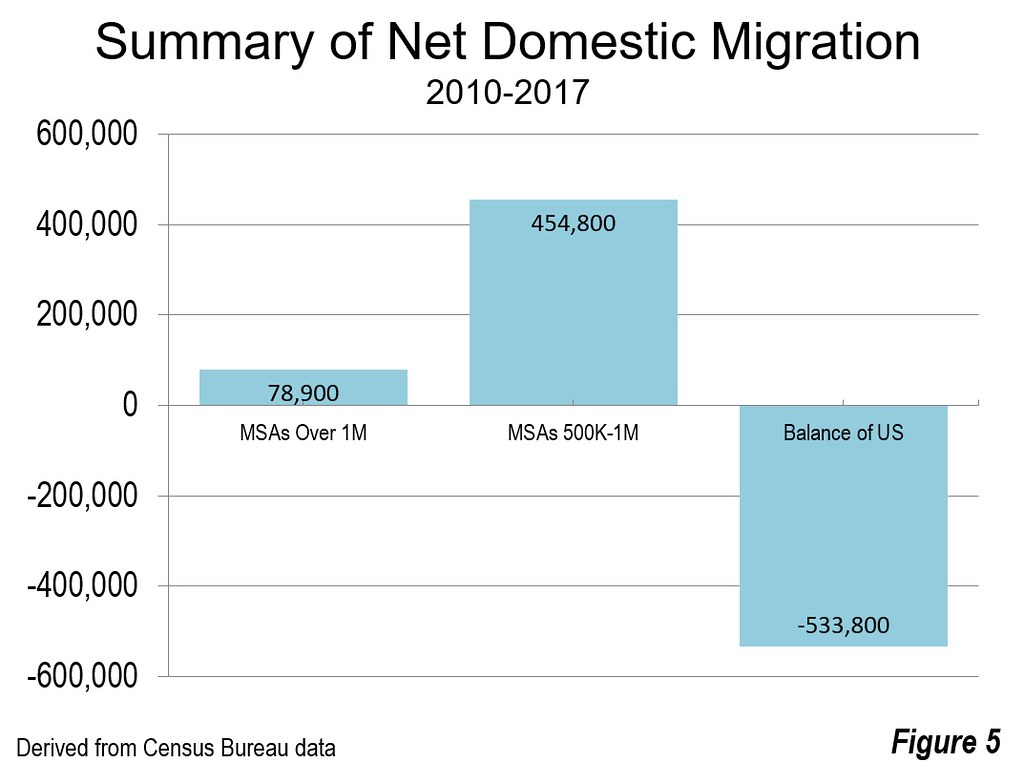
During this decade, the metropolitan areas from 500,000 to 1,000,000 have attracted 455,000 net domestic migrants, compared to only 79,000 by the major metropolitan areas. Thus, the middle-sized metropolitan areas have added nearly six times as many domestic migrants as the major metropolitan areas, despite having less than one-quarter the population at the beginning of the decade. The rest of the nation lost 534,000 net domestic migrants to the metropolitan areas with more than 500,000 population (Figure 5).
Top Gainers and Losers
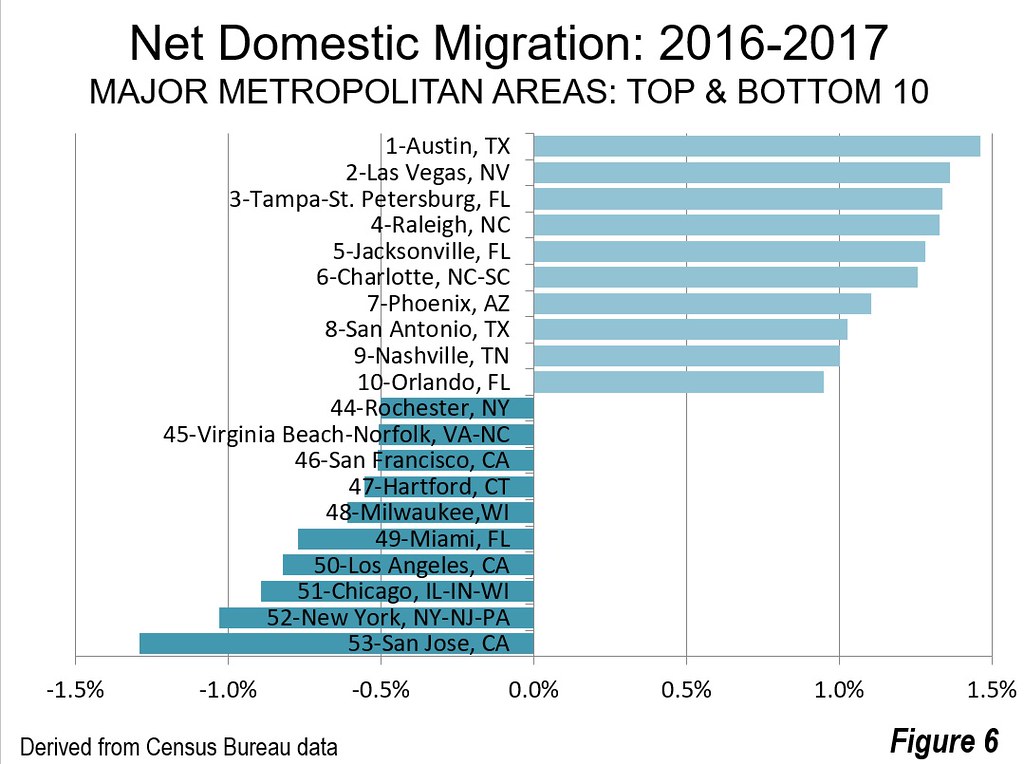
All this resembles a rerun of the 2000s --- with Austin and Las Vegas ranking number one and two. Virtually all of the others in the top ten also experienced strong net domestic migration in the 2000s.
The major metropolitan areas losing the largest share of net domestic migrants are also very familiar from the 2000s, such as San Jose, New York, Miami, Chicago and Los Angeles (Figure 6). “Boomtown” San Francisco, which had done well in domestic migration earlier in the decade, has quickly fallen into the bottom 10, a downward acceleration noted by the Wall Street Journal (see: “San Francisco has a People Problem”).
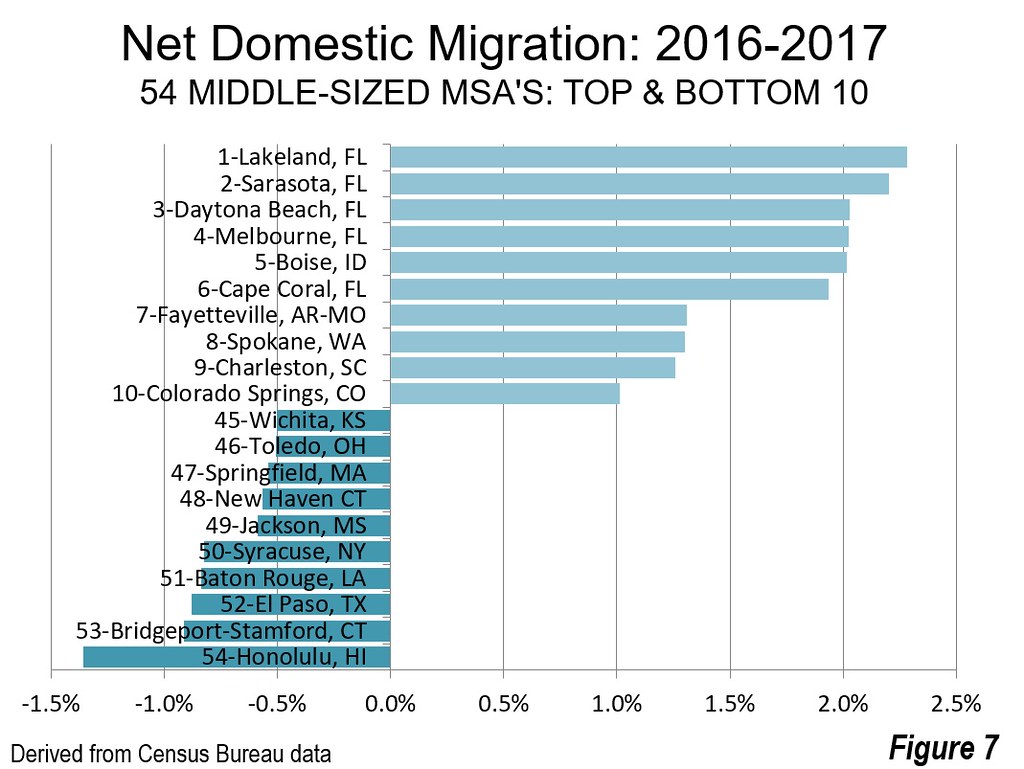
The metropolitan areas in the 500,000 to 1,000,000 population range with the greatest net domestic migration are strongly weighted toward retirement destinations, with five of the top 10 being in Florida, led by Lakeland. Lakeland is also close enough for commuting to Tampa-St. Petersburg and Orlando, which rank among the top 10 major metropolitan areas. The top 10 also includes Boise, ID, as well as Fayetteville, AR-MO, where strong growth has been propelled by Wal-Mart headquarters and related economic activity. The largest domestic migration loss among all metropolitan areas over 500,000 was in Honolulu (Figure 7).
Population Gains and Losses
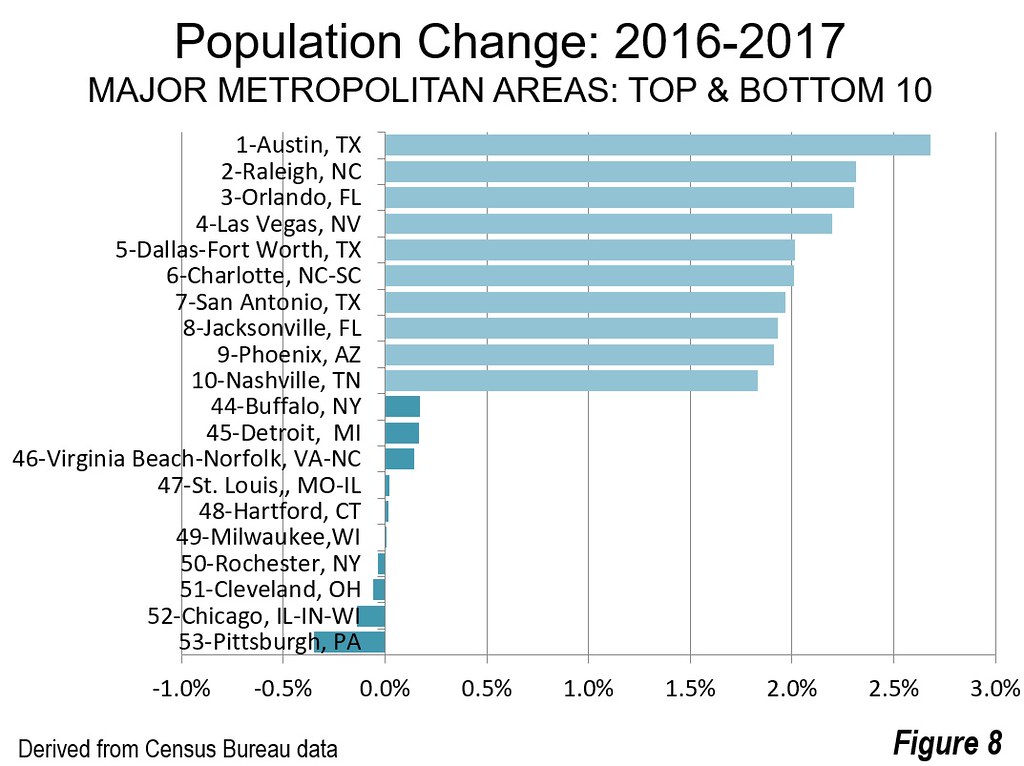
The 10 major metropolitan areas with the largest growth from 2016 to 2017 were all in the South, except for Phoenix and Las Vegas. The largest loss was in Pittsburgh, which has experienced recurring losses. The population within the present boundaries of the Pittsburgh metropolitan area reached 2.77 million in 1960, 420,000 more than today (Figure 8).
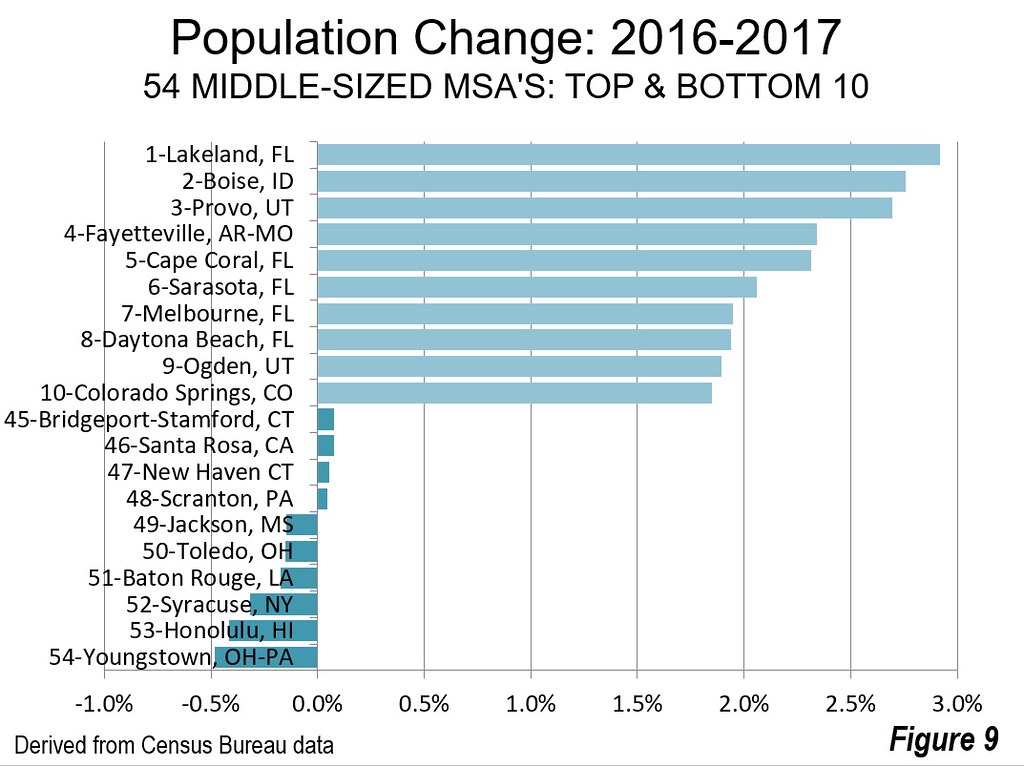
Lakeland was also the leading large metropolitan area for overall growth. Boise, Provo, UT and Fayetteville, AR-MO were also among the top gainers, along with other Florida metropolitan areas. Youngstown, OH experienced the greatest loss, now down 20 percent from its 1970 peak. Honolulu had the second largest loss and moved farther away from the million threshold it nearly reached last year (Figure 9).
Other Notable Developments
The new 2017 metropolitan area population estimates show that Philadelphia and San Francisco have been passed by newer metropolitan areas, Miami and Phoenix. Less than 15 years ago, Philadelphia was the nation’s fourth largest metropolitan area, a position it had held since 1950. When Philadelphia was edged out by Los Angeles the city was then passed by Houston and Washington, and now Miami. Philadelphia now holds 8th place.
Phoenix has replaced San Francisco as the 11th largest metropolitan area in the nation, and is poised to replace 10th ranked Boston by the 2020 census, if present trends continue. Phoenix has a population of 4.74 million, compared to 4.73 million in San Francisco. In 1950, Phoenix had a population below 400,000, well behind San Francisco’s 2.1 million (present land areas), which had been either the West’s first or second largest metropolitan area since metropolitan areas were first delineated.
Meanwhile, the nation’s three largest metropolitan areas are stagnating. Los Angeles grew an anemic 0.19 percent compared to a national average of 0.72 percent. New York did marginally better, at 0.23 percent. In the city of New York growth has virtually stopped, increasing only 7,000 last year, compared to an average of 70,000 annually earlier in the decade. One borough --- Brooklyn --- actually lost population, a reversal from the early 2010s when annual increases exceeded 30,000. Suburban New York, long a laggard, added five residents for every new City resident in 2017. Chicago lost 0.14 percent and has returned to little more than its 2012 population.
Some “Rust Belt” metropolitan areas have long had among the slowest growth such as Detroit, Chicago, Milwaukee, Buffalo and Pittsburgh). Yet this year saw a positive net domestic migration in Minneapolis-St. Paul, Kansas City, Columbus, Cincinnati and Indianapolis. Just five years ago (2012), these metropolitan areas attracted fewer than 2,000 net domestic migrants combined. By 2017, the figure had risen to 43,000. Their near average or lower than average costs of living, strongly related to house prices that are affordable, are a likely contributor.
At the same time, metropolitan areas with higher costs of living such as coastal California (especially Los Angeles, San Francisco, San Diego and San Jose), have experienced a significant deterioration in net domestic migration, expanding their annual loss more than seven times, from nearly 25,000 in 2012 to nearly 180,000 in 2017. Meanwhile, metropolitan areas over 500,000 in interior California have seen their net domestic migration rise from minus 4,000 in 2012 to 38,000 in 2017 (Riverside-San Bernardino, Sacramento, Fresno, Bakersfield, Stockton and Modesto). Population trends reflect the domestic migration decline, with coastal California growing nearly two-thirds less in 2017 than in 2012, and interior California nearing a 50 percent increase.
A Pivotal Year
The 2017 population estimates show that there is a resounding “return to the suburbs,” with historical trends restored after a brief interlude caused by the Great Recession. At the same time, medium-sized metropolitan areas, with either small or no urban cores are gaining many more domestic migrants than their larger cousins. Regrettably much of the mainstream media, not to mention academia and some of the development community, has not woken up to this reality.
Note: Three major metropolitan areas have only one county (San Diego, Las Vegas and Tucson). Domestic migration data is available only at the county level (not, for example, by individual municipalities, except for city-county jurisdictions, such as San Francisco and Baltimore).
| Metropolitan Areas Over 500,000: Population Estimates: 2017 | ||||||||
| Population (Millions) | 2016-2017 | |||||||
| Rank | Metropolitan Areas | 2010 | 2016 | 2017 | Population Change | Rank: Population Change | Net Domestic Migration | Rank: Domestic Migration |
| 1 | New York, NY-NJ-PA | 19.566 | 20.275 | 20.321 | 0.23% | 83 | -1.03% | 105 |
| 2 | Los Angeles, CA | 12.829 | 13.328 | 13.354 | 0.19% | 84 | -0.82% | 99 |
| 3 | Chicago, IL-IN-WI | 9.462 | 9.546 | 9.533 | -0.14% | 100 | -0.89% | 103 |
| 4 | Dallas-Fort Worth, TX | 6.426 | 7.253 | 7.400 | 2.02% | 11 | 0.81% | 24 |
| 5 | Houston, TX | 5.920 | 6.798 | 6.892 | 1.39% | 31 | -0.15% | 68 |
| 6 | Washington, DC-VA-MD-WV | 5.636 | 6.151 | 6.217 | 1.07% | 42 | -0.35% | 80 |
| 7 | Miami, FL | 5.566 | 6.107 | 6.159 | 0.84% | 55 | -0.77% | 98 |
| 8 | Philadelphia, PA-NJ-DE-MD | 5.966 | 6.077 | 6.096 | 0.31% | 79 | -0.30% | 75 |
| 9 | Atlanta, GA | 5.287 | 5.796 | 5.885 | 1.54% | 27 | 0.57% | 33 |
| 10 | Boston, MA-NH | 4.553 | 4.806 | 4.837 | 0.64% | 64 | -0.38% | 84 |
| 11 | Phoenix, AZ | 4.193 | 4.648 | 4.737 | 1.91% | 17 | 1.10% | 16 |
| 12 | San Francisco, CA | 4.336 | 4.699 | 4.727 | 0.60% | 69 | -0.51% | 92 |
| 13 | Riverside-San Bernardino, CA | 4.225 | 4.524 | 4.581 | 1.26% | 35 | 0.47% | 38 |
| 14 | Detroit, MI | 4.296 | 4.306 | 4.313 | 0.17% | 86 | -0.35% | 78 |
| 15 | Seattle, WA | 3.440 | 3.803 | 3.867 | 1.69% | 25 | 0.55% | 35 |
| 16 | Minneapolis-St. Paul, MN-WI | 3.349 | 3.557 | 3.601 | 1.22% | 38 | 0.23% | 48 |
| 17 | San Diego, CA | 3.095 | 3.317 | 3.338 | 0.62% | 65 | -0.48% | 87 |
| 18 | Tampa-St. Petersburg, FL | 2.783 | 3.037 | 3.091 | 1.81% | 22 | 1.34% | 9 |
| 19 | Denver, CO | 2.544 | 2.852 | 2.888 | 1.28% | 34 | 0.42% | 41 |
| 20 | Baltimore, MD | 2.711 | 2.801 | 2.808 | 0.26% | 80 | -0.35% | 81 |
| 21 | St. Louis,, MO-IL | 2.788 | 2.807 | 2.807 | 0.02% | 95 | -0.35% | 79 |
| 22 | Charlotte, NC-SC | 2.217 | 2.476 | 2.525 | 2.01% | 12 | 1.26% | 15 |
| 23 | Orlando, FL | 2.134 | 2.453 | 2.510 | 2.30% | 8 | 0.95% | 20 |
| 24 | San Antonio, TX | 2.143 | 2.426 | 2.474 | 1.97% | 13 | 1.03% | 17 |
| 25 | Portland, OR-WA | 2.226 | 2.423 | 2.453 | 1.24% | 36 | 0.55% | 36 |
| 26 | Pittsburgh, PA | 2.356 | 2.342 | 2.333 | -0.35% | 105 | -0.37% | 83 |
| 27 | Sacramento, CA | 2.149 | 2.295 | 2.325 | 1.29% | 32 | 0.56% | 34 |
| 28 | Las Vegas, NV | 1.951 | 2.157 | 2.204 | 2.20% | 9 | 1.36% | 8 |
| 29 | Cincinnati, OH-KY-IN | 2.115 | 2.166 | 2.179 | 0.60% | 68 | 0.07% | 56 |
| 30 | Kansas City, MO-KS | 2.009 | 2.106 | 2.129 | 1.07% | 43 | 0.41% | 42 |
| 31 | Austin, TX | 1.716 | 2.061 | 2.116 | 2.68% | 4 | 1.46% | 7 |
| 32 | Columbus, OH | 1.902 | 2.047 | 2.079 | 1.55% | 26 | 0.61% | 30 |
| 33 | Cleveland, OH | 2.077 | 2.060 | 2.059 | -0.06% | 99 | -0.39% | 85 |
| 34 | Indianapolis. IN | 1.888 | 2.006 | 2.029 | 1.15% | 41 | 0.39% | 43 |
| 35 | San Jose, CA | 1.837 | 1.991 | 1.998 | 0.38% | 73 | -1.29% | 106 |
| 36 | Nashville, TN | 1.671 | 1.869 | 1.903 | 1.83% | 20 | 1.00% | 19 |
| 37 | Virginia Beach-Norfolk, VA-NC | 1.677 | 1.723 | 1.725 | 0.14% | 89 | -0.51% | 91 |
| 38 | Providence, RI-MA | 1.601 | 1.616 | 1.621 | 0.32% | 77 | -0.16% | 69 |
| 39 | Milwaukee,WI | 1.556 | 1.576 | 1.576 | 0.01% | 97 | -0.61% | 97 |
| 40 | Jacksonville, FL | 1.346 | 1.477 | 1.505 | 1.93% | 16 | 1.28% | 13 |
| 41 | Oklahoma City, OK | 1.253 | 1.372 | 1.384 | 0.82% | 57 | 0.02% | 59 |
| 42 | Memphis, TN-MS-AR | 1.325 | 1.345 | 1.348 | 0.23% | 82 | -0.37% | 82 |
| 43 | Raleigh, NC | 1.130 | 1.305 | 1.335 | 2.31% | 7 | 1.33% | 10 |
| 44 | Richmond, VA | 1.208 | 1.282 | 1.294 | 0.94% | 50 | 0.32% | 44 |
| 45 | Louisville, KY-IN | 1.236 | 1.285 | 1.294 | 0.71% | 59 | 0.19% | 50 |
| 46 | New Orleans. LA | 1.190 | 1.271 | 1.276 | 0.36% | 75 | -0.28% | 74 |
| 47 | Hartford, CT | 1.212 | 1.210 | 1.210 | 0.02% | 96 | -0.56% | 94 |
| 48 | Salt Lake City, UT | 1.088 | 1.186 | 1.203 | 1.44% | 30 | 0.18% | 51 |
| 49 | Birmingham, AL | 1.128 | 1.147 | 1.150 | 0.25% | 81 | -0.03% | 63 |
| 50 | Buffalo, NY | 1.136 | 1.135 | 1.137 | 0.17% | 85 | -0.20% | 71 |
| 51 | Rochester, NY | 1.080 | 1.078 | 1.078 | -0.04% | 98 | -0.50% | 88 |
| 52 | Grand Rapids, MI | 0.989 | 1.049 | 1.059 | 0.98% | 49 | 0.21% | 49 |
| 53 | Tucson, AZ | 0.980 | 1.013 | 1.023 | 1.01% | 46 | 0.60% | 32 |
| 54 | Tulsa, OK | 0.938 | 0.987 | 0.991 | 0.33% | 76 | -0.24% | 73 |
| 55 | Fresno, CA | 0.930 | 0.980 | 0.989 | 0.99% | 48 | -0.05% | 66 |
| 56 | Honolulu, HI | 0.953 | 0.993 | 0.989 | -0.41% | 106 | -1.36% | 107 |
| 57 | Bridgeport-Stamford, CT | 0.917 | 0.949 | 0.950 | 0.08% | 91 | -0.92% | 104 |
| 58 | Worcester, MA-CT | 0.917 | 0.937 | 0.942 | 0.61% | 66 | -0.04% | 64 |
| 59 | Omaha, NE-IA | 0.865 | 0.924 | 0.933 | 1.01% | 47 | 0.04% | 57 |
| 60 | Albuquerque, NM | 0.887 | 0.907 | 0.911 | 0.42% | 71 | 0.02% | 58 |
| 61 | Greenville, SC | 0.824 | 0.885 | 0.896 | 1.29% | 33 | 0.84% | 23 |
| 62 | Bakersfield, CA | 0.840 | 0.885 | 0.893 | 0.91% | 53 | -0.18% | 70 |
| 63 | Albany, NY | 0.871 | 0.883 | 0.886 | 0.38% | 72 | -0.01% | 61 |
| 64 | Knoxville, TN | 0.838 | 0.868 | 0.877 | 1.06% | 44 | 0.93% | 21 |
| 65 | McAllen, TX | 0.775 | 0.850 | 0.861 | 1.23% | 37 | -0.42% | 86 |
| 66 | New Haven CT | 0.862 | 0.860 | 0.860 | 0.05% | 93 | -0.57% | 95 |
| 67 | Oxnard, CA | 0.823 | 0.851 | 0.854 | 0.37% | 74 | -0.32% | 77 |
| 68 | El Paso, TX | 0.804 | 0.841 | 0.845 | 0.43% | 70 | -0.88% | 102 |
| 69 | Allentown, PA-NJ | 0.821 | 0.835 | 0.841 | 0.64% | 63 | 0.17% | 52 |
| 70 | Baton Rouge, LA | 0.803 | 0.836 | 0.834 | -0.17% | 103 | -0.84% | 101 |
| 71 | Columbia, SC | 0.767 | 0.817 | 0.825 | 0.93% | 51 | 0.45% | 40 |
| 72 | Sarasota, FL | 0.702 | 0.788 | 0.805 | 2.06% | 10 | 2.20% | 2 |
| 73 | Dayton, OH | 0.799 | 0.801 | 0.803 | 0.32% | 78 | -0.04% | 65 |
| 74 | Charleston, SC | 0.665 | 0.762 | 0.776 | 1.83% | 21 | 1.26% | 14 |
| 75 | Greensboro, NC | 0.724 | 0.757 | 0.761 | 0.61% | 67 | 0.17% | 53 |
| 76 | Stockton, CA | 0.685 | 0.734 | 0.745 | 1.52% | 29 | 0.63% | 28 |
| 77 | Cape Coral, FL | 0.619 | 0.723 | 0.739 | 2.31% | 6 | 1.94% | 6 |
| 78 | Little Rock, AR | 0.700 | 0.733 | 0.738 | 0.67% | 62 | 0.12% | 55 |
| 79 | Colorado Springs, CO | 0.646 | 0.711 | 0.724 | 1.85% | 19 | 1.01% | 18 |
| 80 | Boise, ID | 0.617 | 0.691 | 0.710 | 2.76% | 2 | 2.02% | 5 |
| 81 | Akron, OH | 0.703 | 0.703 | 0.704 | 0.14% | 90 | -0.12% | 67 |
| 82 | Lakeland, FL | 0.602 | 0.667 | 0.686 | 2.92% | 1 | 2.28% | 1 |
| 83 | Winston-Salem, NC | 0.641 | 0.662 | 0.668 | 0.91% | 52 | 0.65% | 27 |
| 84 | Ogden, UT | 0.597 | 0.653 | 0.665 | 1.89% | 18 | 0.70% | 26 |
| 85 | Syracuse, NY | 0.663 | 0.657 | 0.655 | -0.32% | 104 | -0.83% | 100 |
| 86 | Madison, WI | 0.605 | 0.647 | 0.654 | 1.05% | 45 | 0.26% | 47 |
| 87 | Daytona Beach, FL | 0.590 | 0.637 | 0.649 | 1.94% | 15 | 2.03% | 3 |
| 88 | Des Moines, IA | 0.570 | 0.635 | 0.646 | 1.76% | 23 | 0.76% | 25 |
| 89 | Wichita, KS | 0.631 | 0.645 | 0.646 | 0.15% | 88 | -0.50% | 89 |
| 90 | Springfield, MA | 0.622 | 0.631 | 0.632 | 0.16% | 87 | -0.54% | 93 |
| 91 | Provo, UT | 0.527 | 0.601 | 0.618 | 2.69% | 3 | 0.86% | 22 |
| 92 | Toledo, OH | 0.610 | 0.605 | 0.604 | -0.15% | 102 | -0.51% | 90 |
| 93 | Augusta, GA-SC | 0.565 | 0.595 | 0.600 | 0.88% | 54 | 0.46% | 39 |
| 94 | Melbourne, FL | 0.543 | 0.578 | 0.589 | 1.95% | 14 | 2.02% | 4 |
| 95 | Jackson, MS | 0.568 | 0.580 | 0.579 | -0.15% | 101 | -0.59% | 96 |
| 96 | Harrisburg, PA | 0.549 | 0.568 | 0.572 | 0.69% | 61 | 0.13% | 54 |
| 97 | Durham, NC | 0.507 | 0.559 | 0.567 | 1.52% | 28 | 0.62% | 29 |
| 98 | Spokane, WA | 0.528 | 0.555 | 0.564 | 1.71% | 24 | 1.30% | 12 |
| 99 | Chattanooga, TN-GA | 0.528 | 0.552 | 0.557 | 0.83% | 56 | 0.61% | 31 |
| 100 | Scranton, PA | 0.564 | 0.555 | 0.555 | 0.05% | 94 | -0.02% | 62 |
| 101 | Modesto, CA | 0.514 | 0.541 | 0.548 | 1.21% | 39 | 0.31% | 46 |
| 102 | Lancaster, PA | 0.519 | 0.539 | 0.543 | 0.70% | 60 | -0.01% | 60 |
| 103 | Youngstown, OH-PA | 0.566 | 0.545 | 0.542 | -0.48% | 107 | -0.31% | 76 |
| 104 | Fayetteville, AR-MO | 0.463 | 0.525 | 0.537 | 2.34% | 5 | 1.31% | 11 |
| 105 | Portland, ME | 0.514 | 0.528 | 0.532 | 0.72% | 58 | 0.55% | 37 |
| 106 | Lexington, KY | 0.472 | 0.507 | 0.513 | 1.16% | 40 | 0.31% | 45 |
| 107 | Santa Rosa, CA | 0.484 | 0.504 | 0.504 | 0.08% | 92 | -0.22% | 72 |
| From: US Census Bureau Data | ||||||||
Wendell Cox is principal of Demographia, an international public policy and demographics firm. He is a Senior Fellow of the Center for Opportunity Urbanism (US), Senior Fellow for Housing Affordability and Municipal Policy for the Frontier Centre for Public Policy (Canada), and a member of the Board of Advisors of the Center for Demographics and Policy at Chapman University (California). He is co-author of the "Demographia International Housing Affordability Survey" and author of "Demographia World Urban Areas" and "War on the Dream: How Anti-Sprawl Policy Threatens the Quality of Life." He was appointed to three terms on the Los Angeles County Transportation Commission, where he served with the leading city and county leadership as the only non-elected member. He served as a visiting professor at the Conservatoire National des Arts et Metiers, a national university in Paris.
Photograph: Lakeland, Florida, which led the nation in population increase and net domestic migration gain among metropolitan areas with more than 500,000 population in 2016-2017. Credit: Mikerussell at English Wikipedia [CC BY-SA 3.0 or GFDL], via Wikimedia Commons


