
For the first decades of mass suburbanization, the movement from urban cores often has been referred to as “white flight” (Note 1). But now major metropolitan area living patterns indicate something much different, what might be called “ethnic flight.” The four largest racial and ethnic groups (called “ethnicities” in this article) are overwhelmingly concentrated outside the urban core, in the suburbs and Exurbs. These four largest ethnicities are White Only Not Hispanic, African American Only, Asian Only and Hispanics (Note 2).
This article documents the population and growth of the four largest ethnicities within the 53 major metropolitan areas (over 1,000,000 population) according to the 2012-2016 American Community Survey (middle year 2014) and the change since the 2000 census. These four ethnicities account for more than 95 percent of the nation’s population. The balance of three percent includes smaller one-race ethnicities and people reported to be of multiple races.
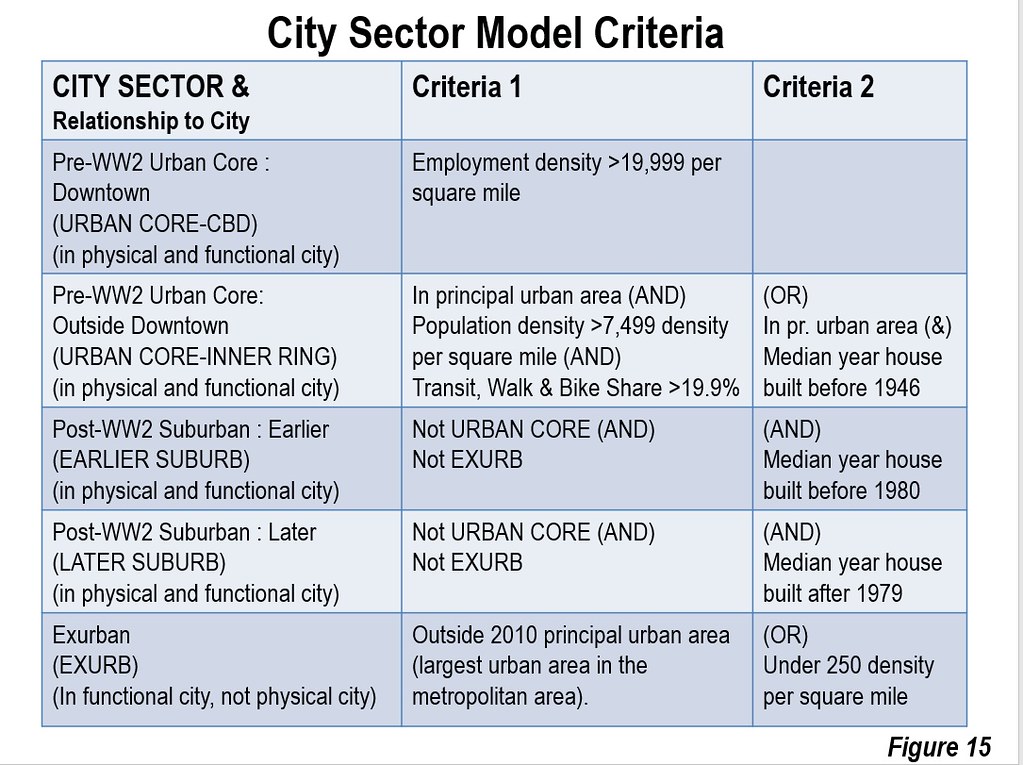
This analysis uses the City Sector Model (Figure 15), which classifies small areas within metropolitan areas based on the nature of their functional urbanization. The classification uses factors such as population density, employment density, automobile orientation and age of development, rather than political jurisdictions (Note 3).
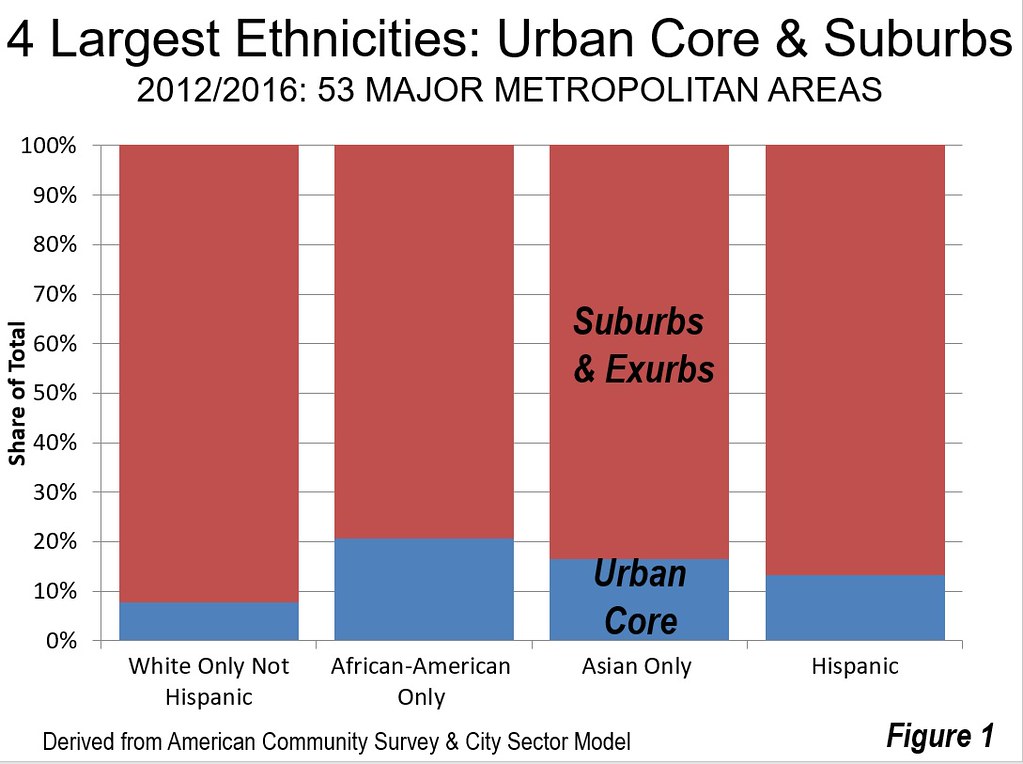
The concentration of the four largest ethnicities in the suburbs and exurbs is now so great that none of these groups have more than 25 percent of their population living in the urban cores. The highest percentage living in the urban core is among the African-American, at 24.4 percent. Asians are second most likely to live in the urban core, at 20.3 percent. Hispanics are even less inclined to live in the urban core, at 17.4 percent. White Non-Hispanics, began moving to the suburbs and exurbs earlier, have the lowest urban core percentage, at 10.0 percent (Figure 1).
White Not Hispanic
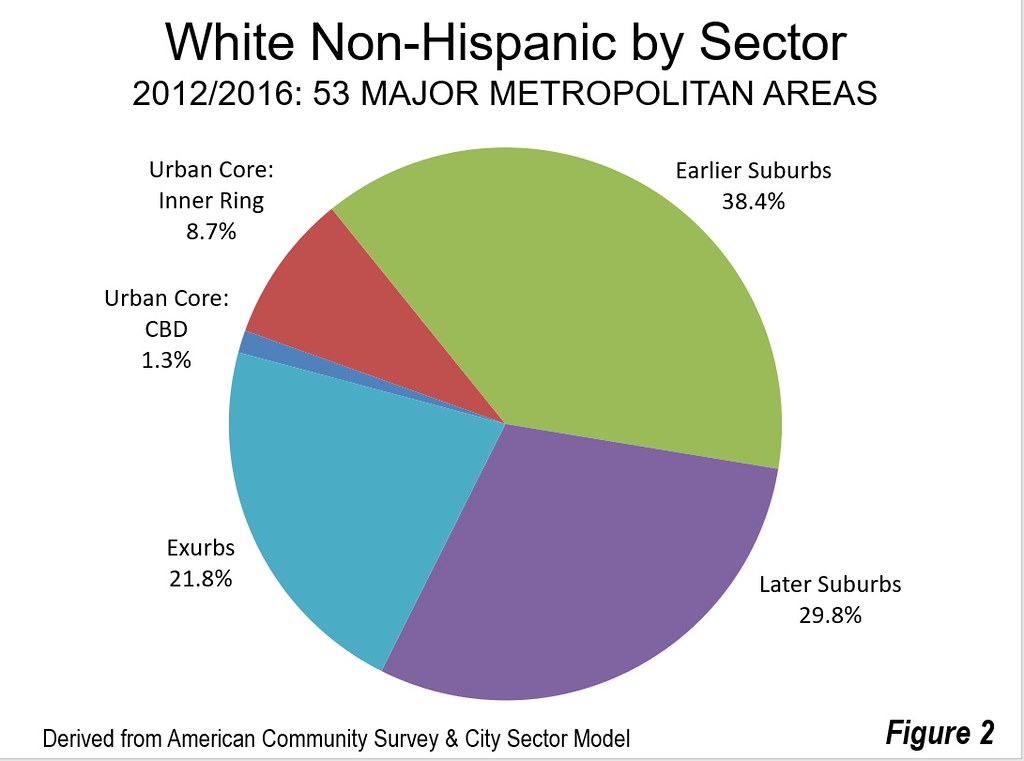
White Non-Hispanics have been overwhelmingly moving to the suburbs since (at least) World War II. The 90 percent living in the suburbs and exurbs includes 38 percent in the Earlier Suburbs, 30 percent in the Later Suburbs and 22 percent in the Exurbs. More than five times as many White Non-Hispanics live in the Later Suburbs and Exurbs as in the urban cores (Figure 2).
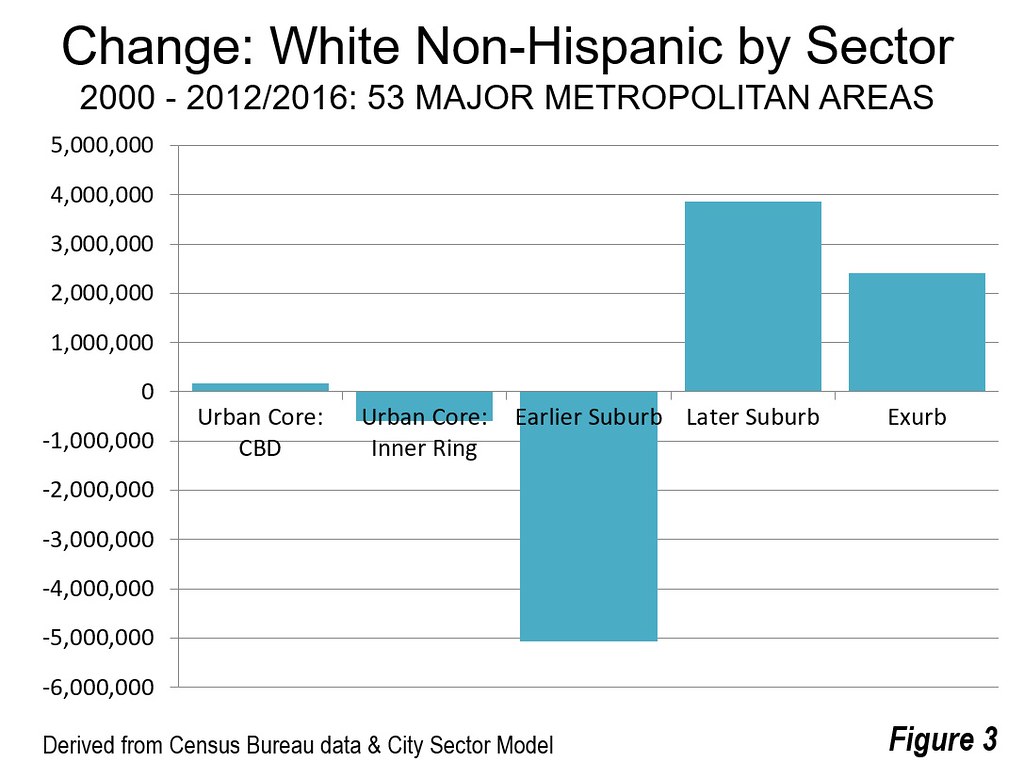
At the same time, White Non-Hispanics continue to increase strongly to the Later Suburbs, adding 5.1 million since 2000, while the inner suburban population,those built generally from World War II through the 1970s, has declined 3.9 million (Figure 3).
African-American
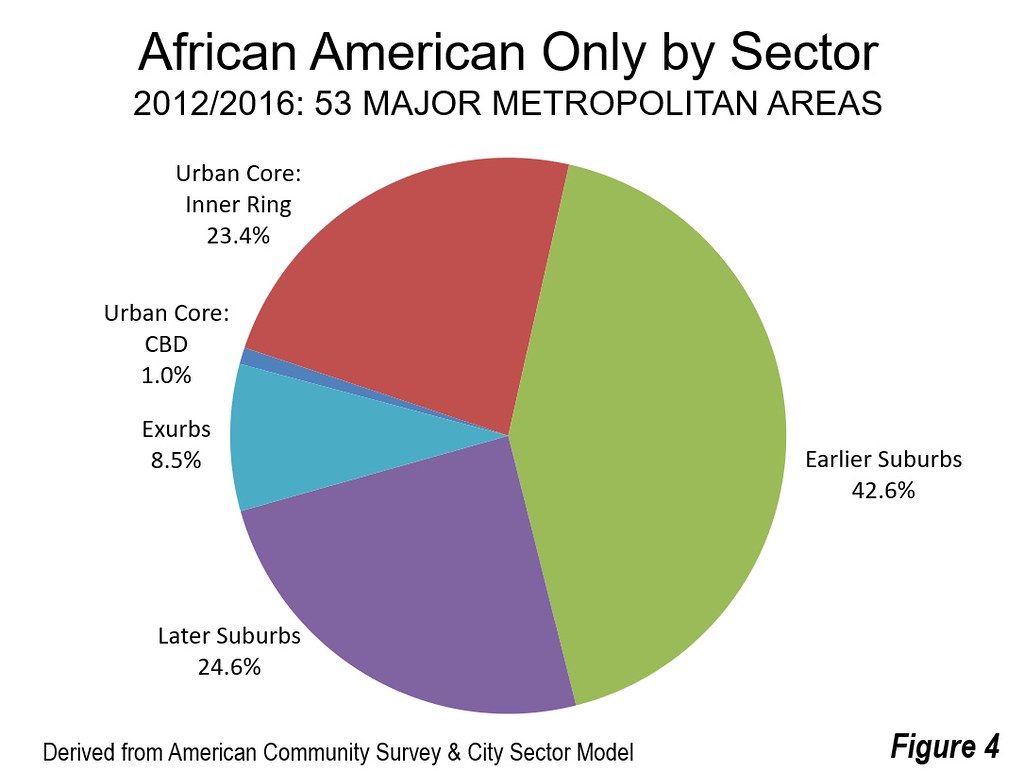
Perhaps most surprising, and least appreciated, is the movement of African-Americans to the suburbs. The more than three-quarters of African-Americans living in the suburbs and exurbs is concentrated in the Earlier Suburbs, where nearly 43 percent live. But a large number of African-Americans also live further out, with 33 percent living in the Later Suburbs and Exurbs, far more than live in the urban cores (Figure 4).
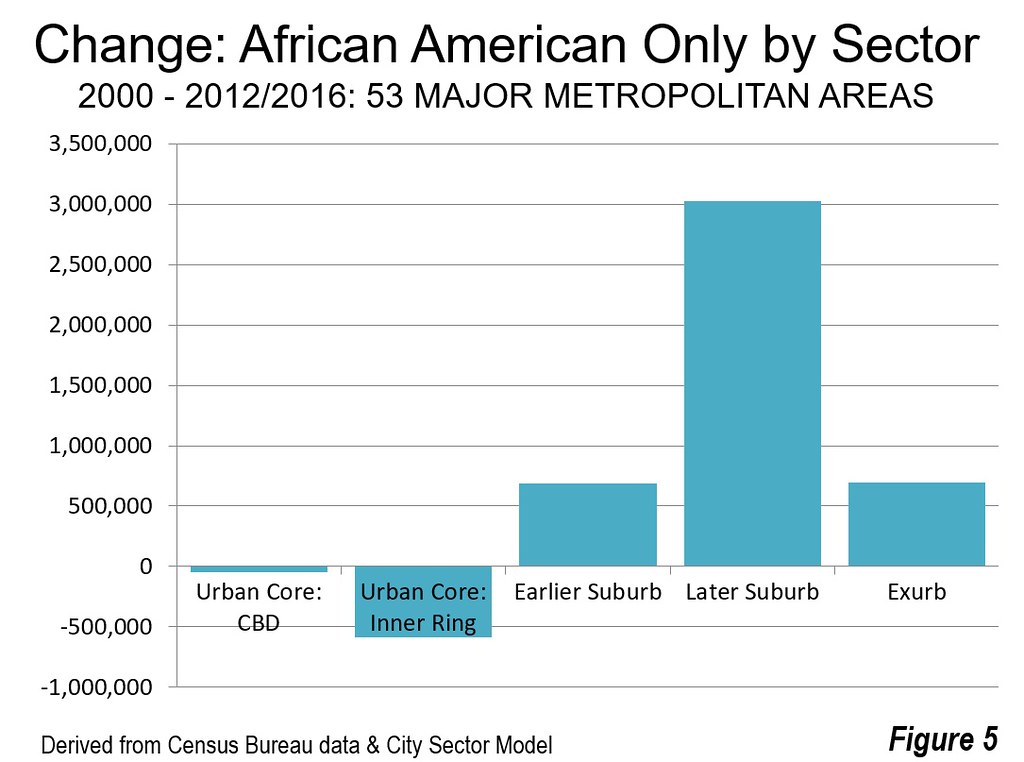
Moreover, this trend is picking up momentum. Since 2000, the African-American population has declined by 640,000 in the urban core, while the suburbs and exurbs have gained 4.4 million. This growth, like that of White Non-Hispanics, now shifts increasingly to the farther reaches of the metropolitan area. The two outer sectors --- the Later Suburbs and the Exurbs --- accounted for nearly 99 percent of African American growth, with only one percent in the three more inner sectors (Figure 5).
Asian
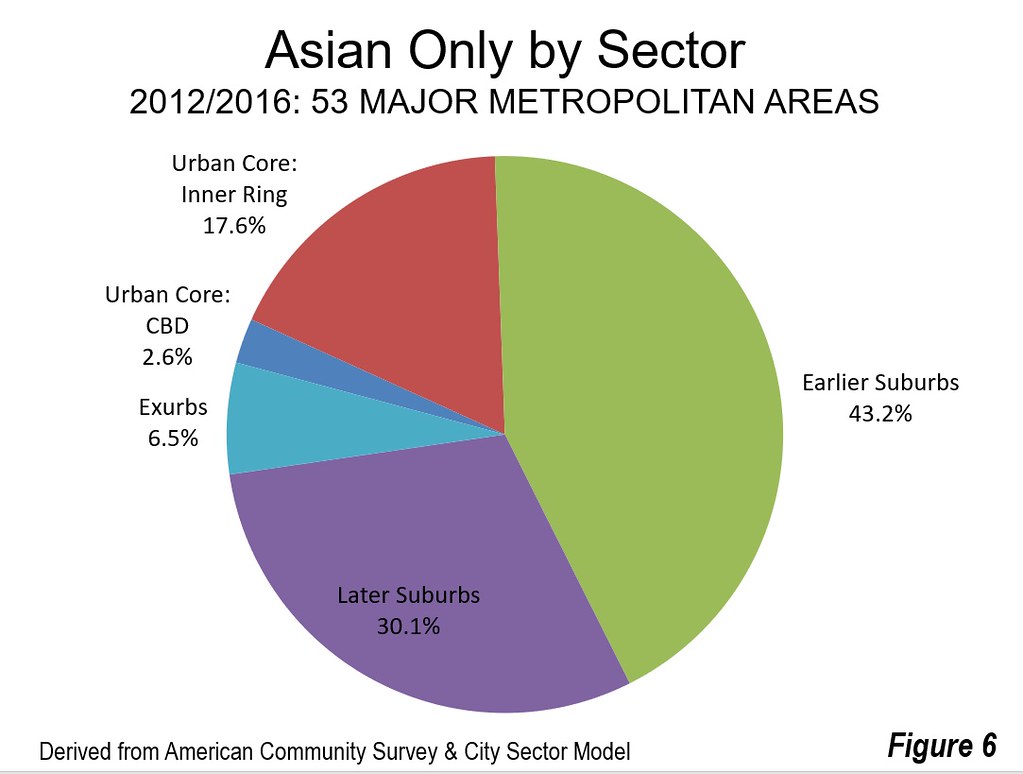
The nearly 80 percent of Asians living in the suburbs and exurbs are mostly found in the Earlier Suburbs (43 percent) and the Later Suburbs (30 percent). The 6.5 percent of Asians living in the Exurbs is the smallest among the four largest ethnicities. About twice as many Asians live in the outer sectors (Later Suburbs and Exurbs) as live in the urban core (Figure 6).
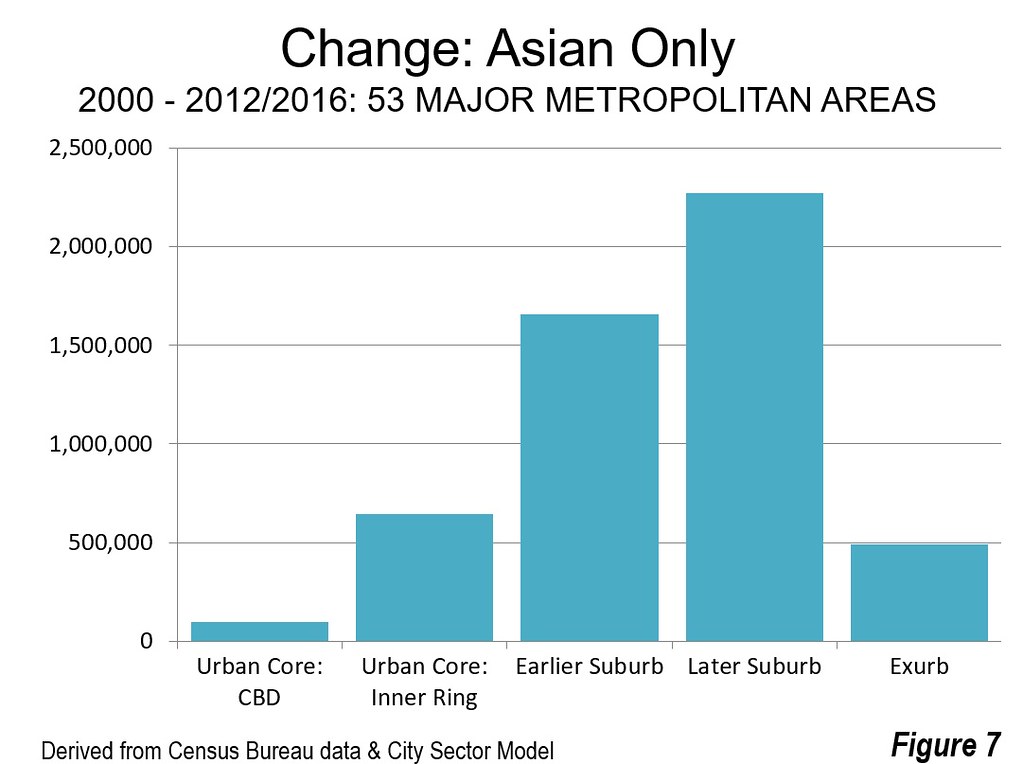
Asian population growth was also concentrated in the suburbs and exurbs with 86 percent of the total. The largest increase was in the Later Suburbs and the second largest growth was in the Earlier Suburbs (Figure 7).
Hispanic
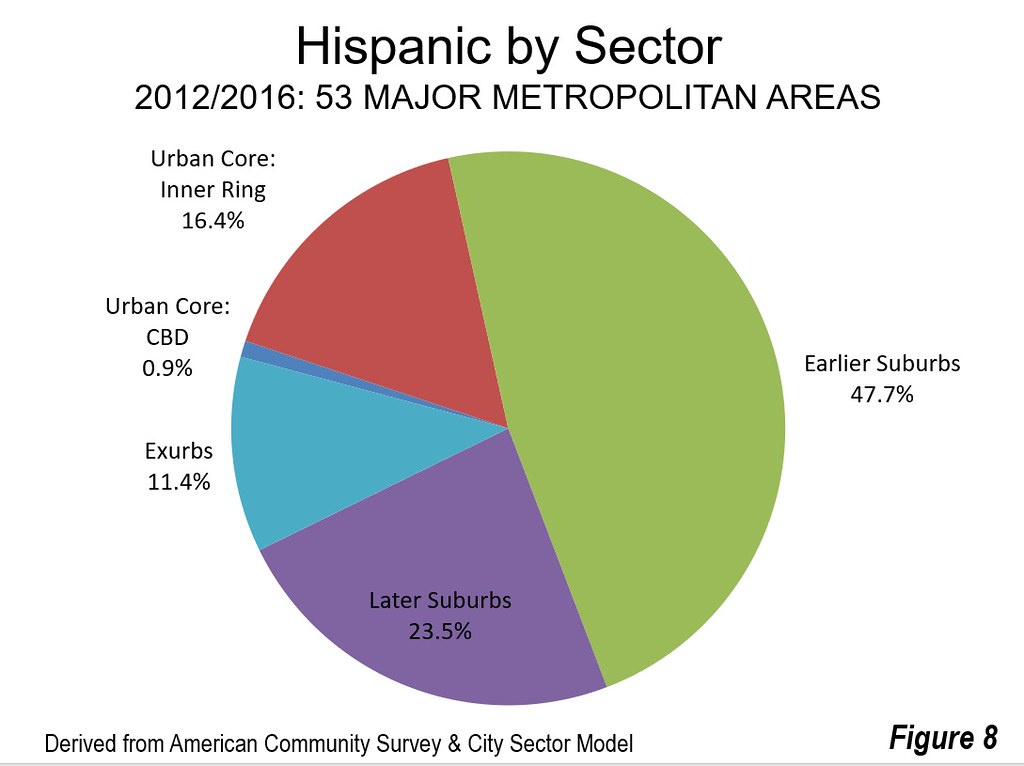
The majority of the 88 percent of Hispanics living in the suburbs and exurbs are concentrated in Earlier Suburbs, although 35 percent now inhabit Later Suburbs and Exurbs, twice as many as now reside in the urban cores (Figure 8).
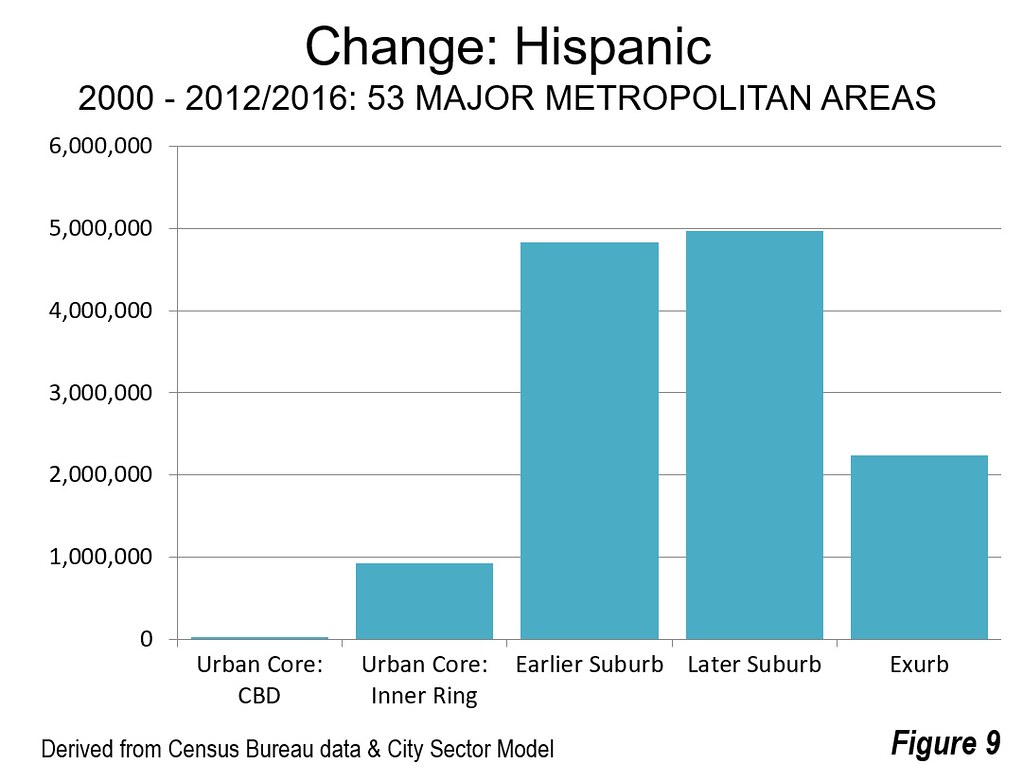
Like the other ethnicities, Hispanics are showing an increasing preference for the suburbs and Exurbs. The Later Suburbs gained the most, at 5.0 million, while the Earlier Suburbs had a gain of 4.8 million. Since 2000, 93 percent of Hispanic population growth has been in these sectors (Figure 9)
Ethnic Trends in the Metropolitan Sectors
There is some double counting in the data, as a result of the two dimensional classification system used by the Census Bureau (race and Hispanic or non-Hispanic). The effect in this data is relatively small, with three percent of African Americans being counted in the African American and Hispanic categories, and one percent of Asians.
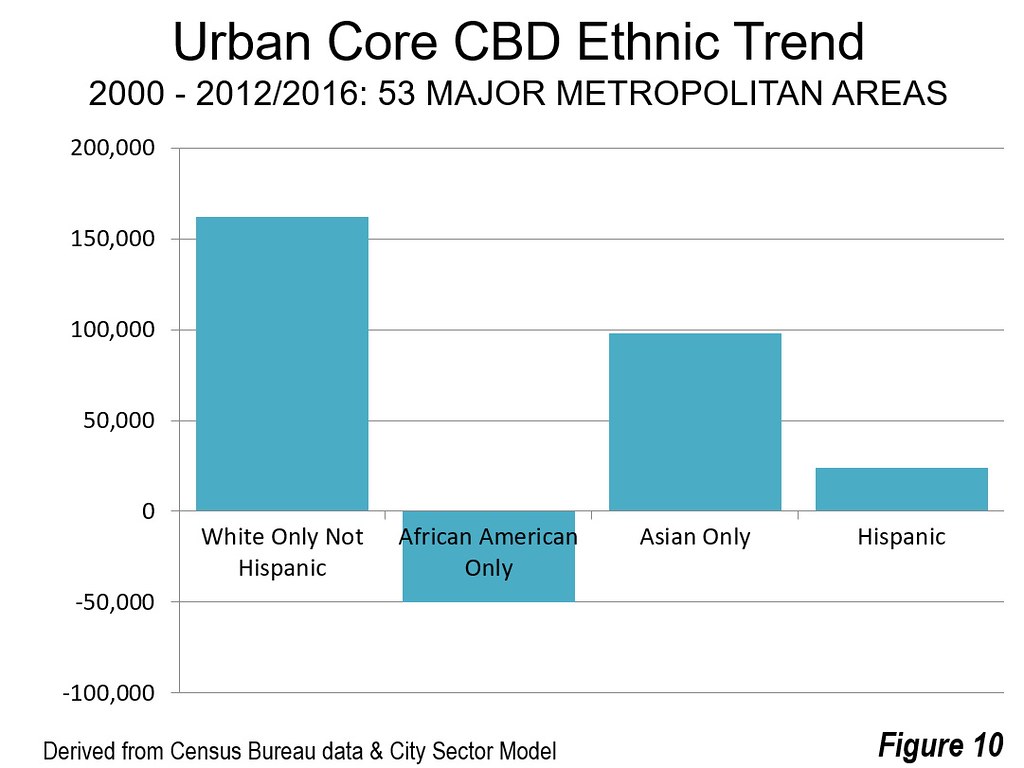
The Urban Core CBDs had the most unusual ethnic trend over the period. The two most affluent larger ethnicities dominated growth. The highest income ethnicity, Asian had growth equal to 42 percent of the total CBD gain. White Non- Hispanics, second in incomes, were equal to 69 percent of the growth. Hispanics equaled 21 percent of the growth. African Americans, the lowest income ethnicity among the four, had losses balancing off the gains of the other three groups, equal to a minus 21 percent of the growth in the CBD (Figure 10).
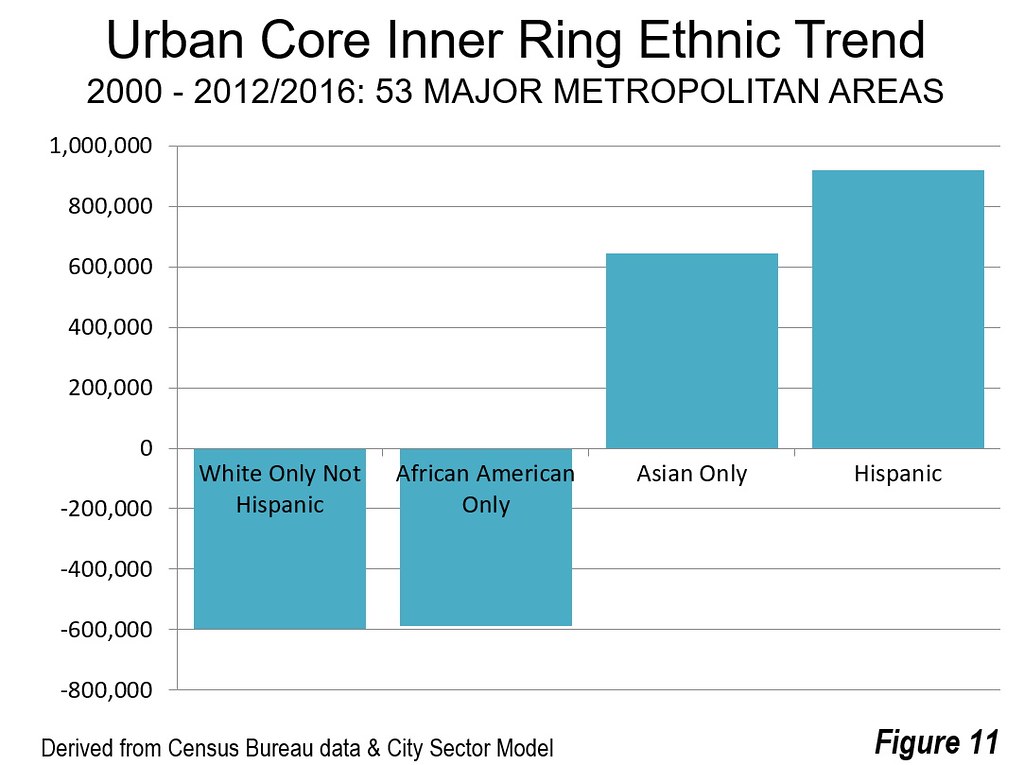
The changes in the other four sectors were substantially larger than in the CBD. In the Urban Core Inner Ring, there were substantial White Non-Hispanic and African American losses, while the Asian and Hispanic populations increased (Figure 11).
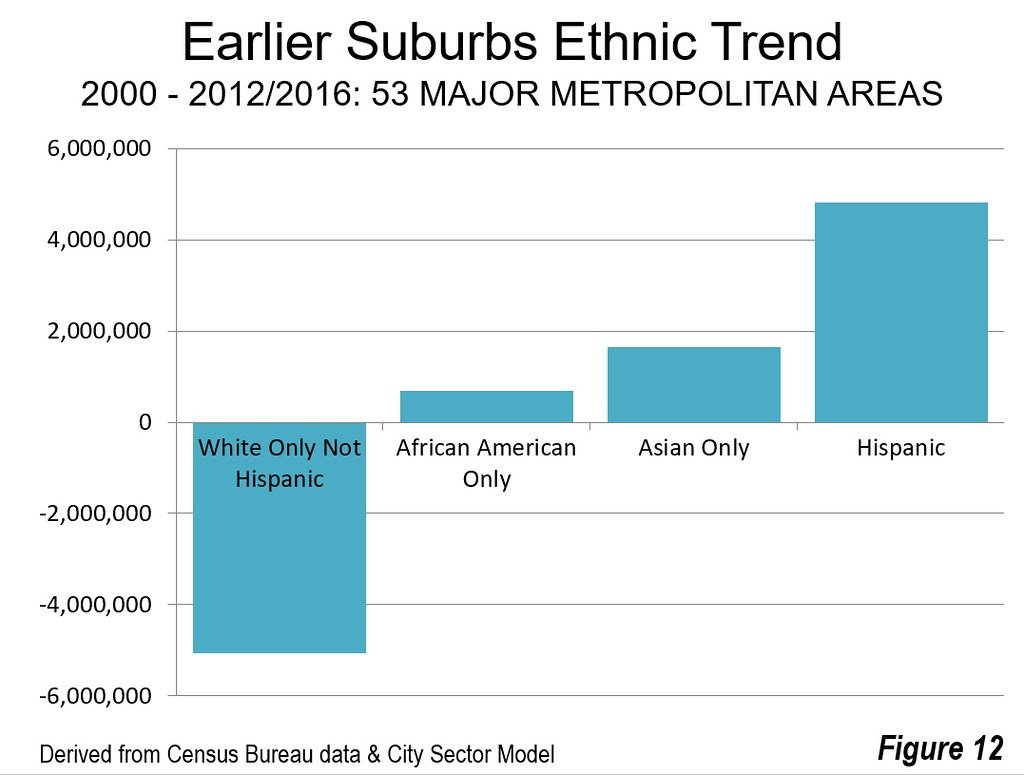
In the Earlier Suburbs, there were substantial White Non- Hispanic losses, comparatively small African American gains, and larger Asian and Hispanic gains (Figure 12).
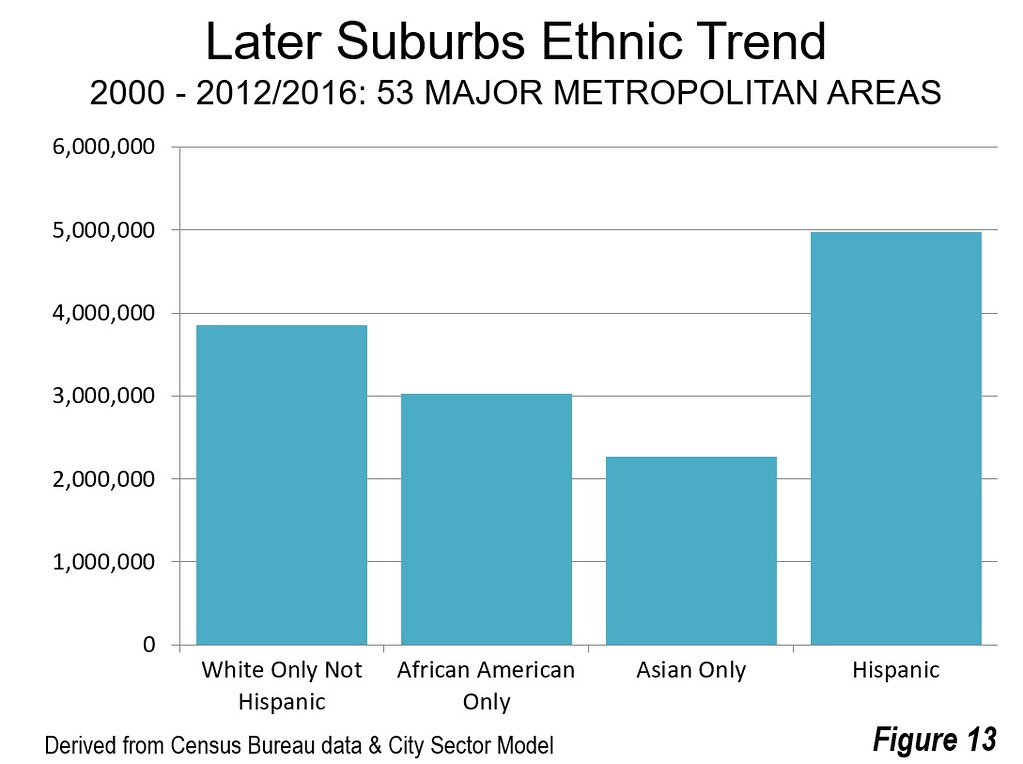
All four ethnicities had large gains in the Later Suburbs, with the largest gain by Hispanics (Figure 13). In the Exurbs there were large gains by White Not Hispanics and Hispanics, while the gains by African Americans and Asians were smaller (Figure 14).
Conclusion
The post-World War II, automobile oriented suburbanization in the United States started out largely as a White Non-Hispanic phenomenon. But as populations and incomes have risen and automobile ownership has become nearly universal, African Americans, Asians and Hispanics have joined them in ever increasing numbers in the suburbs. America’s future may well be more diverse, but it will play itself out primarily on the periphery, not the urban core.
Note 1: The reality is somewhat different, since most suburban growth came from outside the major metropolitan areas, as many more people moved to the suburbs from smaller towns and rural areas than moved from the urban core.
Note 2: For simplicity, these ethnicities will be referred to in this article as White Non-Hispanic, African American and Asian. The “only” designation (as in African American only) refers to persons reporting themselves to be a single race, rather than a combination of two or more. Racial combinations make up less than five percent of the population.
Note 3: The City Sector Model classifies all zip codes in the United States based on population and employment density, commuting patterns and house construction dates. The two Urban Core classifications (CBD and Inner Ring) generally replicate the pre-World War II environment, when urban population densities were much higher and there was much less automobile use. In contrast, the other three classifications (Earlier Suburbs, Later Suburbs and Exurbs) reflect the substantially lower urban population densities and much greater automobile use.

Wendell Cox is principal of Demographia, an international public policy and demographics firm. He is a Senior Fellow of the Center for Opportunity Urbanism (US), Senior Fellow for Housing Affordability and Municipal Policy for the Frontier Centre for Public Policy (Canada), and a member of the Board of Advisors of the Center for Demographics and Policy at Chapman University (California). He is co-author of the "Demographia International Housing Affordability Survey" and author of "Demographia World Urban Areas" and "War on the Dream: How Anti-Sprawl Policy Threatens the Quality of Life." He was appointed to three terms on the Los Angeles County Transportation Commission, where he served with the leading city and county leadership as the only non-elected member. He served as a visiting professor at the Conservatoire National des Arts et Metiers, a national university in Paris.
Photograph: Chicago Suburbs (by author)


