
New Census Bureau employment data indicates that most job creation in the nation’s 53 major metropolitan areas (over 1,000,000 population) continues to be in the suburbs and exurbs. This article describes employment (job) locations by urban sector, using the City Sector Model (described in the Note Figure 4, below). The source of the data is “County Business Patterns, which is published annually for every zip code in the nation, which is unlike the American Community Survey, which uses a five-year period to cover all areas of the nation.
Employment Distribution in the Major Metropolitan Areas
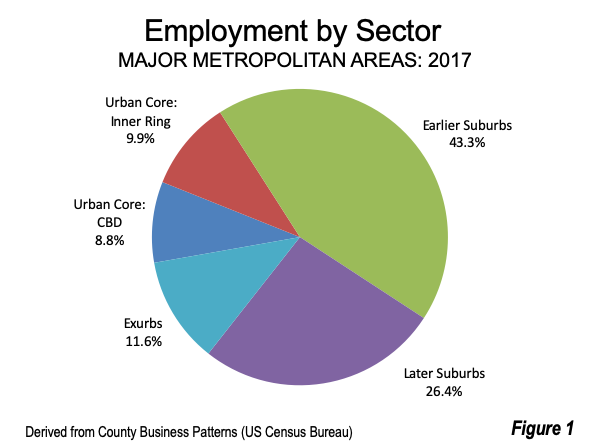
As of 2017 (the latest data), 81.2% of employment in the 53 major metropolitan areas (over 1,000,000 population) was in the suburbs and exurbs. The largest share continues to be in the Earlier Suburbs (generally inner ring suburbs) which had 43.3% of the jobs. The Later Suburbs (generally outer ring suburbs) had 26.4% of the jobs. The Exurbs, the areas outside the built-up urban areas, had the third highest job count, at 11.6% of the total.
The balance of 18.8% of the jobs was in the urban core. The Urban Core Inner Ring, the generally denser areas adjacent to the downtown areas (central business districts or CBDs) had 9.9% of the employment. The smallest share of employment was in the Urban Core: CBDs which had 8.8% of the employment. This is in striking context to the widely held perception that most employment is downtown (Figure 1).
Employment Growth by Sector
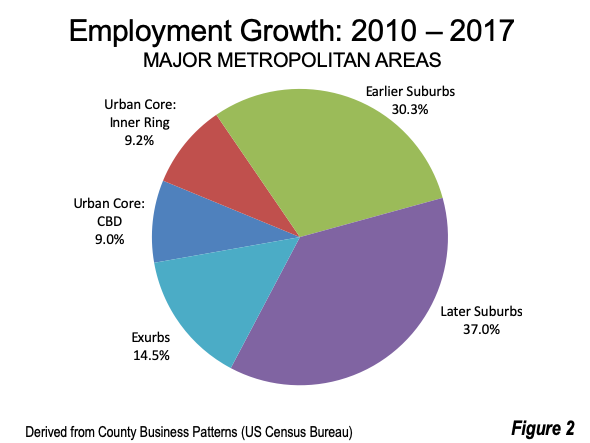
In recent years there was modest dispersion to the suburbs and exurbs from the urban cores in the overall distribution of employment. The suburbs and exurbs have captured 81.8% of the job growth. The largest share was in the Later Suburbs, which had 37% of the growth. The Later Suburbs had a 1.6 percentage point increase in its share of jobs since 2010. The Earlier Suburbs had 30.3% of the growth, but saw their job share drop by 2.0 percentage points. The Exurbs had 14.5% of the growth, with an increased share of 0.4 percentage points.
The urban cores enjoyed 18.2% of the job growth. The Urban Core: Inner Ring lost 0.1% of in share from 2010. The Urban Core: CBDs remained constant with 8.8% of the jobs in both 2010 and 2017 (Figure 2).
The largest numeric growth in employment was also in the Later Suburbs, which added 3.7 million jobs. The Earlier Suburbs added 3.0 million jobs, while the Exurbs added 1.4 million. The Urban Core: Inner Ring added 0.9 million jobs.
The smallest increase in jobs was in the Urban Core: CBDs, added 0.8 million. This is less than two-thirds the number of jobs added in the Exurbs and less than one-seventh that of the suburbs. Approximately half of the Urban Core: CBD gain was in three metropolitan areas. New York accounted for a quarter of the growth, while Chicago and San Francisco nearly evenly split another quarter.
Challenges in the COVID-19 World
Meanwhile, the COVID-19 pandemic could well alter the substantially future of employment distribution. This is likely to be the most challenging for the CBDs. The measures required to minimize spreading a disease transmitted person-to-person in close contact are virtually incompatible with the very nature of CBDs.
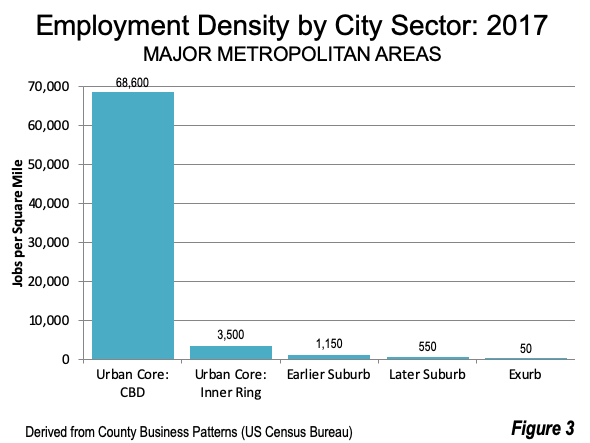
The problem is density – but not just population density, or even employment density (Figure 3). It is exposure density – the accumulated effect of personal contacts that can spread the virus. Greater exposure density likely lead to greater infection risk for people with a higher density of personal contacts over a greater period of time, all else equal. In the largest CBDs, exposure density is intensified by overcrowded buses and trains, with their often long trips, as well as crowded stations, elevators, offices, restaurants and bars.
Elek Pafka, a Lecturer in Urban Planning and Urban Design at the University of Melbourne described the principal factor in infection risk, “So what kind of density is relevant for the spread of coronavirus? It has become increasingly clear COVID-19 is mainly transmitted through extended close contact, particularly in enclosed spaces, where droplets and aerosols accumulate. The density that matters is internal population density – generally measured as square metres per person.”
People are already reducing their exposure densities. Working at home seems likely to retain a substantial, but yet unknown, percentage of its huge recent increase and a number of companies plan to expand the practice. An AEI (American Enterprise Institute) Housing Center analysis of escrow activity suggests substantial share increases in house purchases in the least dense zip codes relative to the densest in the 13 largest combined statistical areas (CSAs).
It seems likely that the nation’s largest CBDs will become less dense and have their metropolitan employment reduced, at least modestly, in the years after COVID-19. They will likely remain attractive to affluent, well-educated and childless people, but may have harder time holding onto people as they enter their late 20s and beyond.
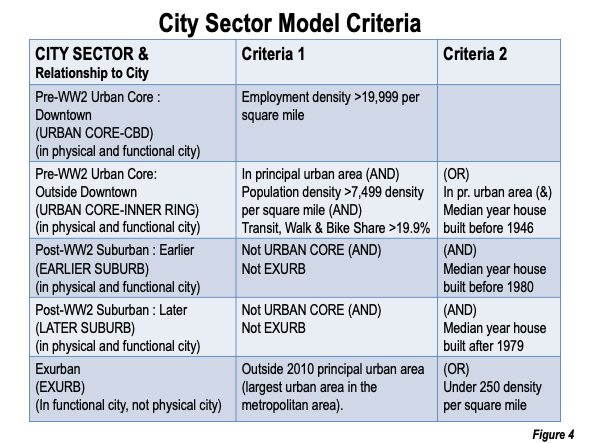
Note: The analysis is based on the City Sector Model (Figure 4), which classifies small areas (ZIP codes, more formally, ZIP Code Tabulation Areas, or ZCTAs) in metropolitan area in the nation based upon their behavioral functions as urban cores, suburbs or exurbs. The criteria used are generally employment and population densities and modes of work trip travel. The purpose of the urban core sectors is to replicate, to the best extent possible, the urban form as it existed before World War II, when urban densities were much higher and when a far larger percentage of urban travel was on transit or by walking. The suburban and exurban sectors replicate automobile-oriented suburbanization that began in the 1920s and escalated strongly following World War II.
Wendell Cox is principal of Demographia, an international public policy firm located in the St. Louis metropolitan area. He is a founding senior fellow at the Urban Reform Institute, Houston and a member of the Advisory Board of the Center for Demographics and Policy at Chapman University in Orange, California. He has served as a visiting professor at the Conservatoire National des Arts et Metiers in Paris,. His principal interests are economics, poverty alleviation, demographics, urban policy and transport. He is co-author of the annual Demographia International Housing Affordability Survey and author of Demographia World Urban Areas.
Mayor Tom Bradley appointed him to three terms on the Los Angeles County Transportation Commission (1977-1985) and Speaker of the House Newt Gingrich appointed him to the Amtrak Reform Council, to complete the unexpired term of New Jersey Governor Christine Todd Whitman (1999-2002). He is author of War on the Dream: How Anti-Sprawl Policy Threatens the Quality of Life and Toward More Prosperous Cities: A Framing Essay on Urban Areas, Transport, Planning and the Dimensions of Sustainability.
Photograph: Lower Manhattan, Woolworth Building in the middle (world’s tallest building, 1913-1930), by author.


