
As the recently ended decade evolved, migration from more costly US metropolitan areas to those with lower costs increased. This developing dispersion is indicated in net domestic migration among the nation’s 384 metropolitan areas from 2010 to 2020. This article categorizes the 384 metropolitan areas by Bureau of Economic Analysis 2020 Regional Price Parities (cost of living), and their net domestic migration. Examples of major metropolitan areas are noted, along with smaller metropolitan areas that have improved hybrid commuting opportunities with the surge in working at home (Note on Hybrid Commuting).
Cost of Living by Metropolitan Area
The Bureau of Economic Analysis Regional Price Parities (RPPs) are the national standard for cost of living estimates. They are based on analysis of prices to adjust expenditures and incomes by removing cost of living differences between states and metropolitan areas.
The RPPs have a national basis (index) of 100, with higher cost metropolitan areas having higher RPPs and lower cost metros lower RPPs. Thus, a metro with an RPP of 115 is estimated to have a cost of living 15% higher than the national average of 100. Similarly, a metro with an RPP of 85 is estimated to have a cost of living 15% lower than the national average.
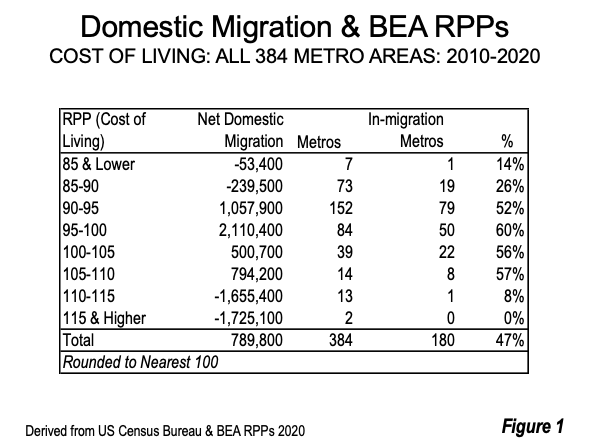
This analysis classifies net domestic migration (movement between the nation’s counties) by eight RPP categories, in increments of five RPP points. The totals are shown in Figure 1.
Metros People are Moving To…
Four of the RPP categories had net domestic migration gains from 2010 to 2020, all of which were in the range of 90 to 110. These categories include 287 of the 384 metros, and 159 of the 180 gains, 88% of the gains.
Cost of Living Index:90 to 95: This category had a net domestic migration gain of 1,057,900. It includes 152 metros, of which 79 gained (52%) and 73 lost. This category, with a 5% to 10% lower than average cost of living, was the second strongest in net domestic migration. Columbus, Ohio and Charlotte are examples of major metros in this category.
A number of the metros are located within “hybrid” commuting distance of one or more major metros --- close enough to work a few days a week or month --- while working at home most of the time. For example Dayton is within hybrid commuting distance of metro Cincinnati, Indianapolis and Columbus. Scranton/Wilkes-Barre is a hybrid commute to metro Philadelphia and higher cost New York.
Cost of Living Index:95 to 100: This category had a net domestic migration gain of 2,011,500, nearly double that of the second strongest category. With costs of living 5% or less below the national average, this category includes 80 metros, of which 50 gained (60%) and 30 lost. Atlanta, Raleigh and Nashville are examples of major metros in this category.
Cost of Living Index:100 to 105: This category, with costs of living up to 5% above the national average, gained 500,700 net domestic migrants. It includes 39 metros, of which 22 gained (56%) and 17 lost net domestic migrants.
This category includes major metros such as Houston, Austin, Phoenix and Chicago (which was one of the migration losers). Norwich-New London, Connecticut is a hybrid commute to Harford, Providence Boston and New York.
Cost of Living Index:105 to 110: This category, with costs of living of from 5% to 10% above average, gained 794,500 net domestic migrants. Eight of the 14 metros gained domestic migrants (57%). Dallas-Fort Worth (which had the greatest numeric domestic migration gain during the decade), Denver and Portland gained in this category, with their strong migration from California.
Metros People are Moving From…
There were net domestic migration losses in the other four RPP categories. These categories sustained net domestic migration losses in 76 of the 97 metropolitan areas and 21 gains. There were net domestic migration losses in the two lowest cost and two highest cost categories. However, only one of the net domestic migration gains were in the higher cost categories, with 20 in the lower cost categories.
Cost of Living Index: Under 85: This category, which has costs of living at least 15% below average, lost 53,400 net domestic migrants. It includes 7 metros, only one of which had a net domestic migration gain (14%). There no major metropolitan areas with RPPs below 85, however Cumberland, Maryland is a hybrid commute example (to Pittsburgh and Washington).
Cost of Living Index: 85 to 90: This category has costs of living from 10% to 15% below the national average and lost 239,500 net domestic migrants. It includes 73 metros, 19 of which had net domestic migration gains (26%). There are no major metropolitan areas in this category.
Cost of Living Index: 110 to 115: This category has costs of living from 10% to 15% more than the national average and lost 1,655,400 net domestic migrants. Only one of the 13 metros (8%) had a net domestic migration gain (Seattle). Metro Los Angeles, Miami, Boston, Washington, San Jose, San Diego and Honolulu are all in this category.
Cost of Living Index: 115 and Higher: The highest BEA RPPs are in metro San Francisco, followed by metro New York. Combined, these metros lost 1,725,000 net domestic migrants between 2010 and 2020 (New York lost 1.640,000).
Move Accelerating to Affordable Costs of Living
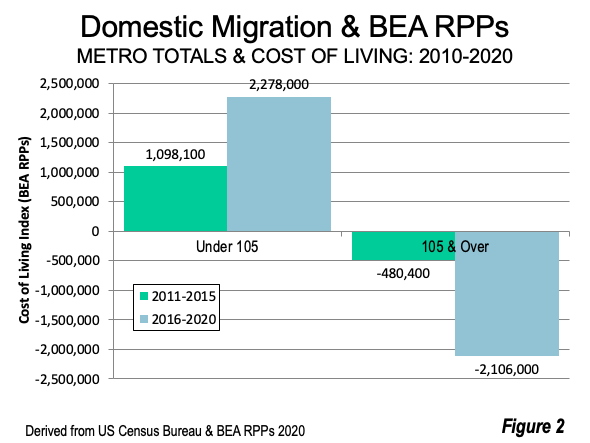
There was a substantial increase in net domestic migration to the metropolitan areas with more affordable costs of living. All of the five most affordable RPP categories (below an RPP of 105) gained net domestic migration, more than doubling from 1.1 million in 2010-2015 to nearly 2.3 million in 2015-2020 (Figure 2). The three least affordable categories (105 and higher) dropped more than three times from a loss of under 500,000 in 2010-2015 to minus 2.1 million in 2016-20.
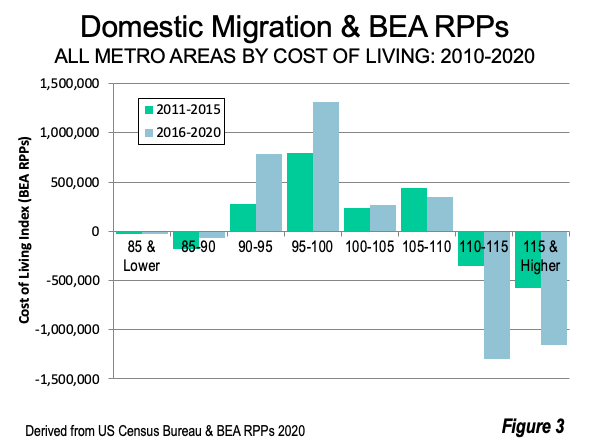
The gains and losses for each of the categories is shown for both five year periods in Figure 3.
Prospects
Already the state Census Bureau population estimates for 2021 indicate increasing out-migration from states with larger urban centers to states likely to be of interest to new hybrid or remote commuters. This could indicate the pandemic influenced dispersion is continuing, as households seek larger houses and yards.
The increasing domestic migration losses in the less affordable metropolitan areas is a consequence of the threat to middle-income affluence documented at the international level by the Organization for International Cooperation and Development (OECD). With the prospect of greater inflation and higher house prices, the move to more affordable costs of living could well even more. All this is supported by the increase in hybrid commuting, as well as a more modest trend toward virtually full-time remote work at home.
Note on Hybrid Commuting: Generally, areas cited for hybrid commuting opportunities are up to about two hours auto access time to the edge of one or more major metropolitan area. This does not necessarily mean access to downtown, since employment is widely distributed throughout metropolitan areas (on average downtowns have less than 10% of metropolitan employment.
Wendell Cox is principal of Demographia, an international public policy firm located in the St. Louis metropolitan area. He is a founding senior fellow at the Urban Reform Institute, Houston, a Senior Fellow with the Frontier Centre for Public Policy in Winnipeg and a member of the Advisory Board of the Center for Demographics and Policy at Chapman University in Orange, California. He has served as a visiting professor at the Conservatoire National des Arts et Metiers in Paris. His principal interests are economics, poverty alleviation, demographics, urban policy and transport. He is co-author of the annual Demographia International Housing Affordability Survey and author of Demographia World Urban Areas.
Mayor Tom Bradley appointed him to three terms on the Los Angeles County Transportation Commission (1977-1985) and Speaker of the House Newt Gingrich appointed him to the Amtrak Reform Council, to complete the unexpired term of New Jersey Governor Christine Todd Whitman (1999-2002). He is author of War on the Dream: How Anti-Sprawl Policy Threatens the Quality of Life and Toward More Prosperous Cities: A Framing Essay on Urban Areas, Transport, Planning and the Dimensions of Sustainability.
Photo: Suburban Charlotte, NC-SC: Example of more house and more yard in a burgeoning domestic migration destination. (by author)


