
Demographia International Housing Affordability rates middle-income housing affordability in 94 major housing markets in eight nations: Australia, Canada, China, Ireland, New Zealand, Singapore, the United Kingdom and the United States. This edition covers the third quarter (September quarter) of 2022.
Assessing Housing Affordability: Often housing affordability is evaluated by simply comparing house prices. However, without consideration of incomes, housing affordability cannot be assessed. Housing affordability is house prices in relation to incomes.
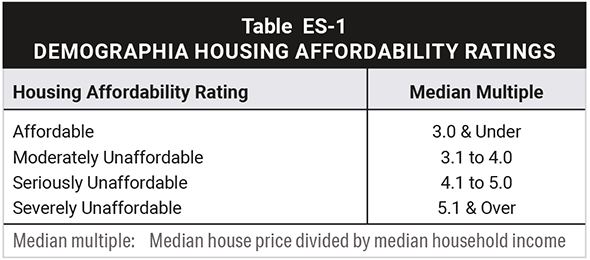 Demographia International Housing Affordability uses the “median multiple” to rate middle-income housing affordability (Table ES-1). The median multiple is a price-to-income ratio, which is the median house price divided by the gross median household income (pre-tax).
Middle-income housing affordability is rated in four categories, ranging from the most affordable (“affordable”) to the least affordable (severely affordable):
Housing markets are metropolitan areas, which are also labor markets. In a well-functioning market, the median priced house should be affordable to a large portion of middle-income households, as was overwhelmingly the case a few decades ago.
Housing affordability comparisons can be made, (1) between housing markets (such as comparison between Adelaide and Melbourne) or (2) over time within the same housing market (such between years in Adelaide).
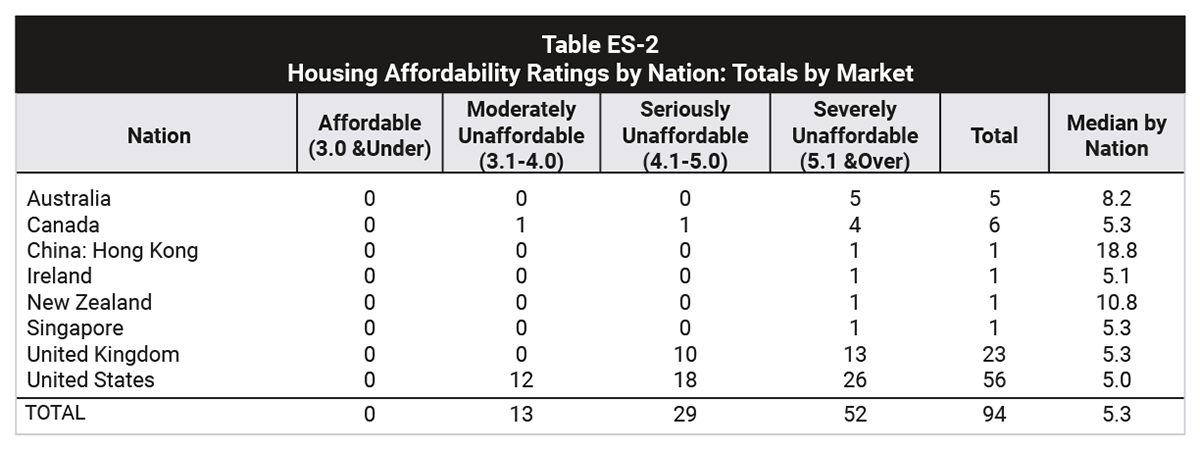
Housing affordability in 2022 is summarized by nation in Table ES-2.
International Housing Affordability in 2022: Housing affordability in 2022 continued to reflect the huge price increases that occurred during the pandemic demand shock. Some housing affordability improvements have since occurred and more are likely as the demand shock is hopefully replaced by more normal market trends.
Hong Kong is the least affordable market, with a median multiple of 18.8. Sydney was the second least affordable at 13.3, Vancouver at 12.0, Honolulu at 11.8, San Jose at 11.5, Los Angeles 11.3, Auckland 10.7, Melbourne at 9.9, Toronto at 9.5 and San Diego at 9.4. The most affordable market is Pittsburgh, at 3.1, followed by Rochester at 3.2, Cleveland and St. Louis, at 3.5.
How Housing Unaffordability Intensifies Inequality: There is a broad view that deteriorating housing affordability is an existential threat to the middle-class.
In Under Pressure: The Squeezed Middle-Class, the OECD finds that the middle-class faces ever costs of living and that rising owned house prices are the “main driver of rising middle-class expenditure.”
Much of the difference in the cost of living between metropolitan areas (within nations) is explained by housing affordability differences. Additionally, a growing body of research indicates a strong association between the declining fertility rates that afflict so many nations and the housing affordability and cost of living crises.
Moreover, as housing becomes more unaffordable, households migrate to more affordable markets. This is illustrated by the substantial net movement occurring from housing markets in the United States and Canada (especially California markets, along with Toronto and Vancouver).
French economist Thomas Piketty has described growing wealth inequality around the world. Matthew Rognlie, of Northwestern University has shown that much of this inequality is traceable to rapidly rising house values, which results in worsening housing affordability.
This is not surprising, since the dominant form of land use regulation around the world has become urban containment, which severely restricts housing construction on the urban periphery, which has been associated with material deterioration in housing affordability and the worsening cost of living crisis.
Where land use policy contributes to deteriorating housing affordability, the resulting increase in inequality can be viewed as an outcome of public policy. Solving the housing affordability problem requires reforms that restore the competitive market for land in highly regulated markets and avoiding land use policies that worsen affordability where competitive land markets continue to exist.
Rognlie suggests that, “A natural first step to combat the increasing role of housing wealth would be to re-examine these regulations and expand the housing supply.”
Elaboration and sources are in the full report. Click here to read and download the full report.
Wendell Cox is principal of Demographia, an international public policy firm located in the St. Louis metropolitan area. He is a founding senior fellow at the Urban Reform Institute, Houston, a Senior Fellow with the Frontier Centre for Public Policy in Winnipeg and a member of the Advisory Board of the Center for Demographics and Policy at Chapman University in Orange, California. He has served as a visiting professor at the Conservatoire National des Arts et Metiers in Paris. His principal interests are economics, poverty alleviation, demographics, urban policy and transport. He is co-author of the annual Demographia International Housing Affordability Survey and author of Demographia World Urban Areas.
Mayor Tom Bradley appointed him to three terms on the Los Angeles County Transportation Commission (1977-1985) and Speaker of the House Newt Gingrich appointed him to the Amtrak Reform Council, to complete the unexpired term of New Jersey Governor Christine Todd Whitman (1999-2002). He is author of War on the Dream: How Anti-Sprawl Policy Threatens the Quality of Life and Toward More Prosperous Cities: A Framing Essay on Urban Areas, Transport, Planning and the Dimensions of Sustainability.
Photo: Future Atlas (futureatlas.com/blog) via Flickr under CC 2.0 License.


